
UNITED STATES
SECURITIES AND EXCHANGE COMMISSION
Washington, D.C. 20549
Form 6-K
REPORT OF FOREIGN PRIVATE ISSUER PURSUANT TO RULE 13a-16 OR 15d-16
UNDER THE SECURITIES EXCHANGE ACT OF 1934
For the month of November, 2026
Commission File Number: 001-43297
AIR Global PLC
(Translation of registrant’s name into English)
Festival Office Tower
Dubai Festival City, 7th Floor
Dubai
United Arab Emirates
(Address of principal executive office)
Indicate by check mark whether the registrant files or will file annual reports under cover of Form 20-F or Form 40-F.
| Form 20-F ☒ | Form 40-F ☐ |
INFORMATION CONTAINED IN THIS REPORT ON FORM 6-K
On November 12, 2026, AIR Global PLC (the “Company”) issued a press release announcing its financial results for the three and nine months ended September 30, 2026 (the “Q3 results”), a copy of which is furnished as Exhibit 99.1 hereto. On the same date, the Company published a presentation in respect of its Q3 results, as well as a Shareholder Letter, copies of which are furnished hereto as Exhibits 99.2 and 99.3, respectively.
SIGNATURE
Pursuant to the requirements of the Securities Exchange Act of 1934, as amended, the registrant has duly caused this report to be signed on its behalf by the undersigned, thereunto duly authorized.
Date: November 12, 2026
| AIR Global PLC | ||
| By: | /s/ Stuart Brazier | |
| Name: | Stuart Brazier | |
| Title: | Chief Executive Officer | |
EXHIBIT INDEX
| Exhibit | Description | |
| 99.1 | Press release of AIR Global PLC, dated November 12, 2026 | |
| 99.2 | ||
| 99.3 | Shareholder Letter of AIR Global PLC, dated November 12, 2026 | |
Exhibit 99.1
| PRESS RELEASE |

|
|
AIR GLOBAL PLC. |

AIR Global Reports Third-Quarter and Nine-Month 2026 Results
Q3’26 revenue increased 11.1% YoY to $99.8 million
Q3’26 Adjusted EBITDA increased 7.7% YoY to $30.9 million
Nine-month revenue increased 6.0% to $306.7 million and Adjusted EBITDA increased 2.3% to $102.7 million
DUBAI, United Arab Emirates, November 12, 2026 — AIR Global PLC (NASDAQ: AIIR), the global leader in Flavored Shisha Molasses (“FSM”), today announces its results for the three and nine-month periods ended September 30, 2026. Unless otherwise specified, all comparative information in this release is presented with reference to the corresponding period of the preceding year.
Stuart Brazier, Chief Executive Officer of AIR Global, said:
“Third-quarter revenue increased 11.1% as volumes grew 5.8% and shipment activity continued to recover from the supply-chain disruptions experienced in the first half of the year. Logistics and material costs remain elevated as a consequence of the geopolitical situation; however, end-consumer demand remains resilient and performance across our key markets was strong, giving us confidence to reiterate our 2026 revenue growth guidance (in U.S. dollars) of 4%–6% and Adjusted EBITDA guidance of low- to mid-single-digit growth.
On October 1, 2026, we issued senior unsecured notes of $425 million with a coupon of 7.875% that mature in 2031, broadening our access to capital and increasing our financial flexibility. We also announced that AIR will pay an annual dividend of $0.28 per share beginning Q1’27, in quarterly installments, and expected to grow progressively thereafter, as well as up to $100 million of share repurchases through December 2029, funded by equity free cash flow1, reflecting our commitment to long-term value creation for our shareholders.
The submission of our PMTA for Crown Switch is an important milestone in AIR’s strategy to build a responsible, science-led presence in the regulated U.S. vaping market. The application reflects a substantial body of evidence spanning product quality, manufacturing, consumer behavior and population-level health impacts. We believe Crown Switch has the potential to provide adult smokers with a differentiated alternative to combustible cigarettes, and we look forward to the FDA’s review.
Our people responded to a period of significant change with focus, agility and determination and this has allowed us to continue to position AIR for its next phase of growth. Our focus now is to translate these strengths into sustainable, profitable growth and attractive long-term returns. “
Bassem Lotfy, Chief Financial Officer of AIR Global, added: “We remain on track to open our Romania factory during Q1’27, which will further diversify our manufacturing footprint and enhance our operational resilience in an uncertain geopolitical environment.
Our capital allocation framework is designed to support long-term value creation. Through equity free cash flow1 generation and with continued growth in Adjusted EBITDA, we expect leverage to decline over time and to be at or below 2.0x by December 2027.”
Webcast and Q&A Session:
AIR Global PLC will hold a live webcast for investors and analysts at 8:00AM ET on November 12, 2026, hosted by Stuart Brazier, CEO and Bassem Lotfy, CFO. The presentation will be followed by a Q&A session. The webcast and presentation slides will be available to view on our website at News/ Events. Conference call dial in details: +1 877 407 0752 or +1 201 389 0912. Alternatively, participants may use the Call Me™ service for immediate access to the event via the following link: Call ME. The Call Me™ service will be available 15 minutes prior to the scheduled start time.
Results Highlights – Q3’26 and 9M’26
(in millions, except percentages and per-share amounts)
| Metric |
|
Q3’26 |
|
|
Q3’25 |
|
|
YoY |
|
|
9M’26 |
|
|
9M’25 |
|
|
YoY |
| ||||||
| Revenue |
|
99.8 |
|
|
89.8 |
|
|
11.1% |
|
|
306.7 |
|
|
289.3 |
|
|
6.0% |
| ||||||
| Gross profit |
|
53.2 |
|
|
48.5 |
|
|
9.8% |
|
|
170.0 |
|
|
162.5 |
|
|
4.6% |
| ||||||
| Operating (loss) / profit |
|
17.9 |
|
|
17.0 |
|
|
5.1% |
|
|
(45.7) |
|
|
68.6 |
|
|
NM |
| ||||||
| (Loss) / profit for the period |
|
7.6 |
|
|
6.7 |
|
|
13.8% |
|
|
(74.2) |
|
|
38.7 |
|
|
NM |
| ||||||
| EBITDA |
|
23.7 |
|
|
21.8 |
|
|
9.0% |
|
|
(28.4) |
|
|
82.8 |
|
|
NM |
| ||||||
| Adjusted EBITDA |
|
30.9 |
|
|
28.7 |
|
|
7.7% |
|
|
102.7 |
|
|
100.3 |
|
|
2.3% |
| ||||||
| Basic EPS ($) |
|
0.052 |
|
|
0.047 |
|
|
10.6% |
|
|
(0.509) |
|
|
0.270 |
|
|
NM |
| ||||||
Note: Percentage changes are based on underlying unrounded figures and may differ from those calculated using the presented figures.
Q3’26 Performance Commentary
| • |
FSM shipment volumes increased 5.8% in Q3’26 as shipment activity continued to normalize following the supply-chain disruptions experienced in H1’26, supported by resilient end-consumer demand. |
| • |
Revenue increased 11.1% to $99.8 million in Q3’26, driven by 5.8% volume growth and 5.0% price/mix. FX impact was minimal, as AIR operates largely in U.S. dollars or U.S. dollar-pegged currencies. |
| • |
Gross profit increased 9.8% to $53.2 million in Q3’26. Cost of sales increased 12.7% to $46.6 million reflecting higher logistics, material and factory footprint costs, resulting in a gross margin of 53.3% vs. 54.0% in Q3’25. |
| • |
Profit for the period increased 13.8% to $7.6 million in Q3’26, compared with $6.7 million in Q3’25. Profit before taxation decreased 1.3% to $8.1 million, reflecting a $2.5 million fair value loss on financial instruments, partly offset by lower net finance costs of $7.2 million compared with $8.7 million in the prior-year quarter. Taxation was $0.4 million, compared with $1.5 million in Q3’25. |
| • |
Adjusted EBITDA increased 7.7% to $30.9 million in Q3’26. Adjusted EBITDA margin was 31.0% vs. 31.9% in Q3’25. |
| • |
Basic EPS was $0.052 in Q3’26, compared with $0.047 in Q3’25, an increase of 10.6% based on the disclosed EPS figures. |
9M’26 Performance Commentary
| • |
FSM shipment volumes declined 4.6% for 9M’26, reflecting the regional disruption and its impact on shipments in the first half of the year. |
| • |
Revenue increased 6.0% to $306.7 million for 9M’26, with price/mix of 11.1% offsetting volume declines. |
| • |
Gross profit increased 4.6% to $170.0 million, with a gross margin of 55.4% vs. 56.2% in 9M’25. |
| • |
Net loss for the period was $74.2 million in the first nine months of 2026, impacted by several one-time items, including: |
| o |
$48.2 million of non-cash listing expense in accordance with IFRS 2, relating to equity issued in connection with the business combination; |
| o |
$47.7 million of IPO-related cash costs; |
| o |
$14.1 million of non-cash share-based compensation expense; |
| o |
$10.5 million of other public company readiness costs; |
| o |
$4.3 million of supply chain-related costs resulting from the Strait of Hormuz disruption; |
| o |
$3.4 million of regulatory costs relating to the preparation and submission of a U.S. Premarket Tobacco Product Application (“PMTA”); and |
| o |
$2.2 million of significant provisions, write-offs and associated legal costs. |
| • |
Adjusted EBITDA increased 2.3% to $102.7 million for 9M’26. Adjusted EBITDA margin was 33.5% vs. 34.7% in 9M’25. |
| • |
Basic loss per share was $0.509, compared with basic earnings per share of $0.270 for the first nine months of 2025. |
2026 Full-Year Outlook
AIR reiterates its full-year 2026 outlook for operating performance:
| • |
Broadly stable shipment volumes compared with FY’25, reflecting the recovery in shipment activity during the second half of the year, despite an approximately 1.5% headwind from weaker Global Travel Retail (GTR) volumes resulting from the Middle East conflict. |
| • |
Revenue growth of 4% to 6% in U.S. dollars. |
| • |
Low- to mid-single-digit Adjusted EBITDA growth, reflecting continued underlying business performance, partly offset by incremental public-company costs, the accelerated reorganization of AIR’s factory footprint, and higher logistics and raw-material costs. |
| • |
Year-end Net Debt to Adjusted EBITDA3 of approximately 2.5x, compared with the prior expectation of approximately 2.1x, primarily reflecting bond-issuance cashflows and the timing of working-capital movements associated with the continuing supply-chain disruption. These working-capital effects are expected to normalize during 2027. |
| • |
An effective tax rate of approximately 15%. |
| • |
Capital expenditures of $11 million to $14 million, compared with $15 million to $18 million previously. |
| • |
We regularly review capital allocation priorities. Future decisions to defer, reduce or discontinue investment in certain workstreams may represent indicators of impairment and could result in the recognition of impairment losses and write-offs where the carrying amount of the related assets exceeds their recoverable amount. |
Medium-Term Outlook
AIR reiterates its FY’27 and medium-term outlook for operating performance:
| • |
Low-single-digit organic FSM shipment-volume growth, supported by continued market-share gains and expansion into new markets, assuming non-disruptive excise-tax increases. |
| • |
Mid-single-digit FSM revenue growth in U.S. dollars. |
| • |
High-single-digit FSM Adjusted EBITDA growth in U.S. dollars. |
| • |
The timing and scale of revenue and Adjusted EBITDA contributions from New Growth Categories will depend on FDA acceptance of AIR’s PMTA applications. |
| • |
Net Debt to Adjusted EBITDA at or below 2.0x by December 2027, including the impact of dividends and share repurchases. |
* No reconciliation to the most directly comparable IFRS financial measures has been provided due to the inherent difficulty in forecasting and quantifying certain amounts necessary for such reconciliation.
Capital allocation
AIR’s capital allocation priorities balance investment in sustainable growth with disciplined shareholder returns and leverage management. The Company intends to commence an annual dividend of $0.28 per share, paid in quarterly installments, with Q1’27 results expected to be announced in May 2027. Thereafter, AIR intends to maintain a progressive dividend policy, with potential future dividend growth supported by earnings expansion, equity free cash flow generation and the Company’s financial position. AIR also intends to undertake up to $100 million of share repurchases through December 2029, subject to market conditions, capital requirements and applicable regulatory approvals. Capital returns are expected to be funded from equity free cash flow, defined as cash flow from operations less capital expenditure, interest expense, and principal and interest payments on lease liabilities. With a growth in Adjusted EBITDA, AIR expects leverage to decline to or below 2.0x by December 2027.
AIR’s capital allocation framework remains focused on investing in high-return growth opportunities, supporting the expansion of the Company’s reduced-risk product portfolio, maintaining a strong balance sheet and prudent leverage profile, and returning excess capital to shareholders through dividends and share repurchases.
Business Review
Segmental Information – Q3’26 and 9M’26
(in millions, except percentages)
| Segment |
|
Q3’26 |
|
|
Q3’25 |
|
|
YoY |
|
|
9M’26 |
|
|
9M’25 |
|
|
YoY |
| ||||||
| Revenue |
||||||||||||||||||||||||
| FSM - Americas |
|
21.9 |
|
|
17.5 |
|
|
25.6% |
|
|
64.8 |
|
|
58.9 |
|
|
10.0% |
| ||||||
| FSM - MEAA |
|
64.1 |
|
|
58.6 |
|
|
9.4% |
|
|
200.8 |
|
|
190.0 |
|
|
5.7% |
| ||||||
| FSM - Europe |
|
13.8 |
|
|
13.2 |
|
|
4.9% |
|
|
39.1 |
|
|
38.2 |
|
|
2.1% |
| ||||||
| New Growth Categories |
|
(0.1) |
|
|
0.6 |
|
|
NM |
|
|
2.1 |
|
|
2.2 |
|
|
(2.6)% |
| ||||||
| Adjusted EBITDA |
||||||||||||||||||||||||
| FSM - Americas |
|
7.8 |
|
|
8.1 |
|
|
(3.6)% |
|
|
27.5 |
|
|
24.9 |
|
|
10.5% |
| ||||||
| FSM - MEAA |
|
25.1 |
|
|
24.5 |
|
|
2.4% |
|
|
84.9 |
|
|
86.8 |
|
|
(2.2)% |
| ||||||
| FSM - Europe |
|
0.9 |
|
|
0.0 |
|
|
NM |
|
|
1.1 |
|
|
1.8 |
|
|
(41.7)% |
| ||||||
| New Growth Categories |
|
(2.9) |
|
|
(3.9) |
|
|
NM |
|
|
(10.8) |
|
|
(13.2) |
|
|
NM |
|
Note: Percentage changes are based on underlying unrounded figures and may differ from those calculated using the presented figures.
Q3’26 Segment Commentary
Americas
Revenue increased 25.6% to $21.9 million in Q3’26, driven by 28.5% volume growth and negative 2.3% price/mix, driven by timing of trade incentives. Adjusted EBITDA decreased 3.6% to $7.8 million, mainly reflecting higher cost of goods sold.
MEAA
Revenue increased 9.4% to $64.1 million in Q3’26, driven by 3.0% volume growth and 6.2% positive price/mix. Adjusted EBITDA increased 2.4% to $25.1 million, dampened by higher ongoing central office costs associated with being a public company and higher cost of goods sold.
Europe
Revenue increased 4.9% to $13.8 million in Q3’26, driven by 6.9% volume growth and negative price/mix of 1.8%. Adjusted EBITDA was $0.9 million, compared with breakeven in the prior-year period. Europe remained challenging, as excise tax increases and a lack of enforcement continue to drive illicit products.
New Growth Categories
Revenue was negative $0.1 million in Q3’26, reflecting timing of trade incentives, compared with positive $0.6 million in Q3’25. The Adjusted EBITDA loss narrowed to $2.9 million from $3.9 million in the prior-year period. The narrower loss reflects lower operating costs and more focused investment behind new product launches.
9M’26 Segment Commentary
Americas
Americas revenue increased 10.0% to $64.8 million for 9M’26, driven by 7.4% volume growth and 2.4% price/mix. Adjusted EBITDA increased 10.5% to $27.5 million.
MEAA
MEAA revenue increased 5.7% to $200.8 million for 9M’26, with price/mix of 13.5% offsetting a 6.9% volume decline. Adjusted EBITDA decreased 2.2% to $84.9 million.
Europe
Europe revenue increased 2.1% to $39.1 million for 9M’26, driven by 11.3% volume growth and negative price/mix of 8.2%. Adjusted EBITDA decreased to $1.1 million from $1.8 million.
NGC
New Growth Categories revenue decreased 2.6% to $2.1 million for the first nine months of 2026. The Adjusted EBITDA loss narrowed to $10.8 million from $13.2 million in the prior-year period.
Impact of the Strait of Hormuz Disruption
The closure of the Strait of Hormuz disrupted AIR’s supply chain during the first half of 2026 and affected the timing of shipments across several key markets. AIR established alternative routes and accelerated changes to its factory footprint to reduce its long-term dependence on the Strait. Shipment activity recovered as alternative routes came into operation, supporting stronger revenue growth in the third quarter.
Greentank Strategic Investment
On July 29, 2026, AIR announced a $20 million strategic investment in Greentank at a pre-money valuation of $170 million, together with an option to increase its ownership stake by a further 20% during the following 24 months at a valuation of $250 million. The partnership provides AIR with commercial advantages and supports the planned U.S. launch of Crown Switch.
Adjusted EBITDA Reconciliation
Reconciliation of (loss)/ profit for the period to adjusted EBITDA
|
Nine-month period ended 30 September |
|
2026 |
|
|
|
|
|
2025 |
| |||
|
|
$000 |
|
|
$000 |
| |||||||
| (Loss) / profit for the period |
|
(74,177) |
|
|
38,690 |
| ||||||
| Add / (subtract): |
||||||||||||
| Taxation |
|
4,276 |
|
|
6,905 |
| ||||||
| Finance costs |
|
21,645 |
|
|
30,276 |
| ||||||
| Finance income |
|
(632) |
|
|
(7,919) |
| ||||||
| Depreciation – property, plant and equipment |
|
3,703 |
|
|
3,762 |
| ||||||
| Depreciation – right-of-use assets |
|
2,888 |
|
|
2,498 |
| ||||||
| Amortization |
|
10,734 |
|
|
7,981 |
| ||||||
| Share of results in joint venture |
|
374 |
|
|
603 |
| ||||||
| Changes in fair value of derivative financial instruments |
|
2,807 |
|
|
— |
| ||||||
| EBITDA |
|
(28,382) |
|
|
82,796 |
| ||||||
| Non-recurring items: |
| Share-based compensation (i) |
|
14,077 |
|
|
|
|
|
3,405 |
| |||
| Corporate restructuring costs |
|
797 |
|
|
1,091 |
| ||||||
| Significant provisions, write-offs and associated legal costs |
|
2,164 |
|
|
8,710 |
| ||||||
| Public company readiness cost (ii) |
|
10,450 |
|
|
4,342 |
| ||||||
| Extraordinary costs caused by regional disruption (iii) |
|
4,253 |
|
|
- |
| ||||||
| Regulatory costs (iv) |
|
3,411 |
|
|
- |
| ||||||
| Fees related to BCA transaction (v) |
|
47,735 |
|
|
- |
| ||||||
| Expense of equity issued at BCA transaction date (net) (vi) |
|
48,150 |
|
|
- |
| ||||||
| Adjusted EBITDA |
|
102,655 |
|
|
100,344 |
| ||||||
Please note that further details on Adjusted EBITDA, including footnotes (i)–(vi), are included in Appendix C.
Share Count
At the end of Q3’26, AIR had approximately 155.39 million ordinary shares outstanding, including approximately 8.69 million Earnout Shares, which will vest only if specified share-price thresholds are achieved by May 15, 2031.
Debt Financing
In September 2026, AIR priced a $425 million senior unsecured notes offering, representing an important step in strengthening the Company’s capital structure and financial flexibility. The notes carry a coupon of 7.875% and mature in 2031. The offering subsequently closed on October 1, 2026, and the proceeds were used to fully refinance the existing term loan facility and repay the outstanding revolving credit facility.
Glossary
1. Equity free cash flow: AIR defines equity free cash flow as cash flow from operations less capital expenditure, interest expense, and principal and interest payments on lease liabilities.
2. AIR defines EBITDA as earnings for the period before interest, taxation, depreciation and amortization. The most directly comparable IFRS measure is profit/(loss) for the period. EBITDA is an intermediate step in AIR’s calculation of Adjusted EBITDA, as set out in Appendix C.
3. AIR defines Adjusted EBITDA as earnings before interest, taxes, depreciation and amortization, further adjusted to exclude items such as non-recurring expenses, share-based compensation and other non-operating expenses. Adjusted EBITDA is not a measure specifically defined under IFRS. The most directly comparable IFRS measure is profit/(loss) for the period. A reconciliation is set out in Appendix C.
4. AIR defines Net Debt as total borrowings (comprising current and non-current interest-bearing loans and borrowings and lease liabilities) less cash and cash equivalents, each as reported on AIR’s IFRS statement of financial position. AIR defines the ratio of Net Debt to Adjusted EBITDA (“leverage”) as Net Debt divided by Adjusted EBITDA. Neither Net Debt nor the Net Debt to Adjusted EBITDA ratio is presented in accordance with IFRS; the most directly comparable IFRS measures are total borrowings and cash and cash equivalents, each as reported on AIR’s statement of financial position. AIR believes this ratio is a useful measure of AIR’s capital structure and progress toward its target leverage. A reconciliation of profit/(loss) for the period to EBITDA and Adjusted EBITDA is set forth in Appendix C, and a reconciliation of total borrowings to Net Debt is set forth under “Reconciliation of total borrowings to Net Debt / Adjusted EBITDA” below.
See “Use of Non-IFRS Financial Measures” for further information regarding the non-IFRS financials measures included in this press release.
Appendix
Appendix A: Condensed Consolidated Statement of Financial Position
| As at |
30 September |
31 December |
||||||
|
|
$000 |
|
|
$000 |
| |||
| ASSETS |
||||||||
|
Non-current assets |
||||||||
| Property, plant and equipment |
|
26,153 |
|
|
28,410 |
| ||
| Right-of-use assets |
|
15,529 |
|
|
11,663 |
| ||
| Intangible assets |
|
366,420 |
|
|
371,277 |
| ||
| Trade and other receivables |
|
74 |
|
|
293 |
| ||
| Investments in joint ventures |
|
1,881 |
|
|
2,255 |
| ||
| Financial asset at FVOCI |
|
12,476 |
|
|
- |
| ||
| Derivative financial instruments |
|
1,137 |
|
|
- |
| ||
| Deferred tax assets |
|
42,246 |
|
|
41,071 |
| ||
|
|
465,916 |
|
|
454,969 |
| |||
| Current assets |
||||||||
| Inventories |
|
73,020 |
|
|
55,331 |
| ||
| Trade and other receivables |
|
130,591 |
|
|
93,160 |
| ||
| Restricted deposit |
|
18,200 |
|
|
- |
| ||
| Advance tax |
|
2,258 |
|
|
274 |
| ||
| Cash and cash equivalents |
|
38,944 |
|
|
119,456 |
| ||
|
|
263,013 |
|
|
268,221 |
| |||
| Total assets LIABILITIES |
|
728,929 |
|
|
723,190 |
| ||
|
Non-current liabilities |
||||||||
| Derivative financial instruments |
|
- |
|
|
1,216 |
| ||
| Other interest-bearing loans and borrowings |
|
303,622 |
|
|
357,679 |
| ||
| Lease liabilities |
|
13,728 |
|
|
9,935 |
| ||
| Employee benefits |
|
6,765 |
|
|
6,542 |
| ||
| Deferred tax liabilities |
|
390 |
|
|
436 |
| ||
|
|
324,505 |
|
|
375,808 |
| |||
| Current liabilities |
||||||||
| Other interest-bearing loans and borrowings |
|
82,496 |
|
|
29,852 |
| ||
| Derivative financial instruments |
|
401 |
|
|
558 |
| ||
| Employee benefits |
|
1,344 |
|
|
1,320 |
| ||
| Lease liabilities |
|
3,895 |
|
|
3,348 |
| ||
| Trade and other payables |
|
114,140 |
|
|
99,121 |
| ||
| Tax payable |
|
2,780 |
|
|
2,053 |
| ||
| Payables relating to acquisitions |
|
1,760 |
|
|
1,760 |
| ||
|
|
206,816 |
|
|
138,012 |
| |||
| Total liabilities |
|
531,321 |
|
|
513,820 |
| ||
| Net assets
EQUITY |
|
197,608 |
|
|
209,370 |
| ||
| Capital and reserves |
||||||||
| Share capital |
|
16 |
|
|
968,768 |
| ||
| Share premium |
|
1,017,725 |
|
|
39,834 |
| ||
| Merger reserve |
|
(1,100,361) |
|
|
(1,100,361) |
| ||
| Cash flow hedge reserve |
|
- |
|
|
(1,614) |
| ||
| Translation reserve |
|
6,389 |
|
|
9,194 |
| ||
| Other reserve |
|
44,702 |
|
|
31,101 |
| ||
| Retained earnings |
|
229,137 |
|
|
262,448 |
| ||
| Net equity |
|
197,608 |
|
|
209,370 |
| ||
Appendix B: Condensed Consolidated Statement of Comprehensive (loss) / income
| Nine-month period ended 30 September |
2026 |
2025 |
||||||
|
|
$000 |
|
|
$000 |
| |||
| Revenue |
|
306,721 |
|
|
289,304 |
| ||
| Cost of sales |
|
(136,744) |
|
|
(126,832) |
| ||
| Gross profit |
|
169,977 |
|
|
162,472 |
| ||
| Distribution expenses |
|
(34,047) |
|
|
(33,704) |
| ||
| General and administrative expenses |
|
(91,662) |
|
|
(59,205) |
| ||
| Provision for expected credit losses on trade receivables |
|
(1,114) |
|
|
(2,078) |
| ||
| Other operating (losses) / gains* |
|
(88,861) |
|
|
1,070 |
| ||
| Operating (loss) / profit |
|
(45,707) |
|
|
68,555 |
| ||
| Share of net loss of investments accounted for using the equity method |
|
(374) |
|
|
(603) |
| ||
| Changes in fair value of derivative financial instruments |
|
(2,807) |
|
|
0 |
| ||
| Finance income |
|
632 |
|
|
7,919 |
| ||
| Finance costs |
|
(21,645) |
|
|
(30,276) |
| ||
| (Loss) / profit before taxation |
|
(69,901) |
|
|
45,595 |
| ||
| Taxation |
|
(4,276) |
|
|
(6,905) |
| ||
| (Loss) / profit for the period |
|
(74,177) |
|
|
38,690 |
| ||
| Other comprehensive (loss) / income |
|
— |
|
|
— |
| ||
| Items that may be reclassified to profit or loss: |
|
— |
|
|
— |
| ||
| Foreign currency translation differences – foreign operations |
|
(2,805) |
|
|
71 |
| ||
| Changes in fair value of cash flow hedges |
|
3,381 |
|
|
(2,201) |
| ||
| Amounts reclassified to profit or loss from cash flow hedges |
|
(1,767) |
|
|
1,002 |
| ||
| Items that will not be reclassified to profit or loss: |
|
— |
|
|
— |
| ||
| Changes in fair value of financial asset at FVOCI |
|
(3,669) |
|
|
0 |
| ||
| Other comprehensive income / (loss) for the period, net of income tax |
|
(4,860) |
|
|
(1,128) |
| ||
| Total comprehensive (loss) / income for the period |
|
(79,037) |
|
|
37,562 |
| ||
| Earnings per share for profit attributable
to the |
|
— |
|
|||||
| Basic (loss) / earnings per share |
|
(0.509) |
|
|
0.270 |
| ||
| Diluted (loss) / earnings per share |
|
(0.509) |
|
|
0.269 |
| ||
Earnings per share
| Nine-month period ended 30 September |
2026 | 2025 | ||||||
| (Losses) / earnings for the purposes of basic and diluted earnings per share as profit for the period attributable to the ordinary equity holders of the parent company ($000) |
|
(74,177) |
|
|
38,690 |
| ||
| Average of ordinary shares outstanding |
|
145,729,991 |
|
|
143,515,060 |
| ||
| Basic (loss) / earnings per share attributable ($) |
|
(0.509) |
|
|
0.270 |
| ||
| Average of diluted shares outstanding |
|
145,729,991 |
|
|
143,565,992 |
| ||
| Diluted (loss) / earnings per share attributable ($) |
|
(0.509) |
|
|
0.269 |
| ||
| Weighted average number of shares used as the denominator: |
||||||||
| Weighted average number of ordinary shares used as the denominator in calculating basic earnings per share |
|
145,729,991 |
|
|
143,515,060 |
| ||
| Adjustments for calculation of diluted earnings per share: |
||||||||
| Employee share options plans |
|
- |
|
|
50,932 |
| ||
| Weighted average number of ordinary shares and potential ordinary shares used as the denominator in calculating diluted earnings per share |
|
145,729,991 |
|
|
143,565,992 |
| ||
Appendix C: Reconciliation of (loss) / profit for the period to adjusted EBITDA
| Nine-month period ended 30 September |
2026 | 2025 | ||||||
| $000 | $000 | |||||||
| (Loss) / profit for the period |
|
(74,177) |
|
|
38,690 |
| ||
| Add / (subtract): |
||||||||
| Taxation |
|
4,276 |
|
|
6,905 |
| ||
| Finance costs |
|
21,645 |
|
|
30,276 |
| ||
| Finance income |
|
(632) |
|
|
(7,919) |
| ||
| Depreciation – property, plant and equipment |
|
3,703 |
|
|
3,762 |
| ||
| Depreciation – right-of-use assets |
|
2,888 |
|
|
2,498 |
| ||
| Amortisation |
|
10,734 |
|
|
7,981 |
| ||
| Share of results in joint venture |
|
374 |
|
|
603 |
| ||
| Changes in fair value of derivative financial instruments |
|
2,807 |
|
|
- |
| ||
| EBITDA |
|
(28,382) |
|
|
82,796 |
| ||
| Non recurring items: |
||||||||
| Share-based compensation (i) |
|
14,077 |
|
|
3,405 |
| ||
| Corporate restructuring costs |
|
797 |
|
|
1,091 |
| ||
| Significant provisions, write-offs and associated legal costs |
|
2,164 |
|
|
8,710 |
| ||
| Public company readiness cost (ii) |
|
10,450 |
|
|
4,342 |
| ||
| Extraordinary costs caused by regional disruption (iii) |
|
4,253 |
|
|
- |
| ||
| Regulatory costs (iv) |
|
3,411 |
|
|
- |
| ||
| Fees related to BCA transaction (v) |
|
47,735 |
|
|
- |
| ||
| Expense of equity issued at BCA transaction date (net) (vi) |
|
48,150 |
|
|
- |
| ||
| Adjusted EBITDA |
|
102,655 |
|
|
100,344 |
| ||
Reconciliation of (loss) / profit for the quarter to Adjusted EBITDA – Q3’26 and Q3’25
| Three-month period ended 30 September |
2026 |
2025 |
||||||
|
|
$000 |
|
|
$000 |
| |||
| (Loss) / profit for the period |
|
7,643 |
|
|
6,717 |
| ||
| Add / (subtract): |
||||||||
| Taxation |
|
444 |
|
|
1,474 |
| ||
| Finance costs |
|
7,229 |
|
|
8,660 |
| ||
| Finance income |
|
(85) |
|
|
(108) |
| ||
| Depreciation – property, plant and equipment |
|
1,211 |
|
|
1,268 |
| ||
| Depreciation – right-of-use assets |
|
984 |
|
|
839 |
| ||
| Amortisation |
|
3,628 |
|
|
2,635 |
| ||
| Share of results in joint venture |
|
134 |
|
|
274 |
| ||
| Changes in fair value of derivative financial instruments |
|
2,524 |
|
|
- |
| ||
| EBITDA |
|
23,712 |
|
|
21,759 |
| ||
| Non recurring items: |
||||||||
| Share-based compensation (i) |
|
1,638 |
|
|
2,398 |
| ||
| Corporate restructuring costs |
|
94 |
|
|
(93) |
| ||
| Significant provisions, write-offs and associated legal costs |
|
489 |
|
|
2,204 |
| ||
| Public company readiness cost (ii) |
|
3,085 |
|
|
2,417 |
| ||
| Extraordinary costs caused by regional disruption (iii) |
|
458 |
|
|
- |
| ||
| Regulatory costs (iv) |
|
1,431 |
|
|
- |
| ||
| Fees related to BCA transaction (v) |
|
- |
|
|
- |
| ||
| Expense of equity issued at BCA transaction date (net) (vi) |
|
- |
|
|
- |
| ||
| Adjusted EBITDA |
|
30,907 |
|
|
28,685 |
| ||
(i) Share-based compensation principally relates to the Milestone Incentive Plan and Retention Awards established for senior management in connection with the listing event. These arrangements are one-time programs linked to the completion of an exit event; the related charges will continue to be recognized over the remaining vesting period in accordance with IFRS 2.
(ii) During the periods, the Group incurred public-company readiness and related costs, including the initial implementation of SOX compliance requirements, remediation activities relating to previously reported material weaknesses in internal control over financial reporting, SEC registration and listing-related activities, and related legal, accounting and advisory services. These costs were incurred in connection with the Group’s transition to a publicly listed company and are not representative of its ongoing public-company compliance costs.
(iii) Regional disruption rendered certain established supply and logistics routes temporarily unavailable. The Group incurred incremental costs to air-freight materials and finished goods and to secure a key ingredient under short-term supply arrangements at prices above normal market conditions. Other rerouting and situational inflation costs remain within operating results.
(iv) Regulatory costs principally comprise consulting, advisory and research fees supporting preparation and submission of a U.S. Premarket Tobacco Product Application. Management considers these applications infrequent and non-recurring relative to the Group’s normal operating activities.
(v) BCA transaction fees relate to the Business Combination Agreement that took effect on May 15, 2026, and comprise sponsor marketing and advisory fees of $32.6 million, redemption fees on shares redeemed of $4.1 million, and other advisory, legal and administrative fees of $11.0 million.
(vi) In connection with the Business Combination Agreement, the Group issued 4,408,369 shares (including 1,500,000 subject to earnout performance conditions) at an average fair value of $11.45 per share, totaling $50.5 million of share premium. Of this, $2.3 million was received in cash, and the remaining $48.2 million was recognized as a non-cash charge in the statement of comprehensive income in accordance with IFRS 2.
Reconciliation of total borrowings to Net Debt / Adjusted EBITDA
| (in millions) |
9M’26 |
|||
| Total borrowings (including lease liabilities) (i) |
403.7 | |||
| Less: Cash and cash equivalents |
(38.9) | |||
| Net Debt (ii) |
364.8 | |||
| Rolling 12 Months Adjusted EBITDA* (iii) |
141.6 | |||
| Net Debt / Adjusted EBITDA (iv) |
2.6x | |||
*Note: Net Debt / Adjusted EBITDA as of September 30, 2026 is calculated using rolling twelve-month Adjusted EBITDA, comprising 9M’26 Adjusted EBITDA plus Q4’25 Adjusted EBITDA. Q4’25 Adjusted EBITDA is derived by deducting 9M’25 Adjusted EBITDA from FY’25 Adjusted EBITDA as previously reported.
(i) Represents total borrowings, comprising current and non-current interest-bearing loans and borrowings and lease liabilities, as reported on the consolidated statement of financial position.
(ii) Represents total borrowings (including “current and non-current borrowings” as shown in the consolidated statement of financial position) less cash and cash equivalents.
(iii) Represents earnings before interest, taxes, depreciation and amortization, further adjusted to exclude items such as non-recurring expenses, share-based compensation and other non-operational items.
(iv) Represents Net Debt divided by Adjusted EBITDA. Net Debt/Adjusted EBITDA is a non-IFRS leverage ratio and differs from the gearing ratio (net debt divided by total capital) presented in AIR’s historical financial statements.
Forward-Looking Statements
This press release contains forward-looking statements within the meaning of the U.S. Private Securities Litigation Reform Act of 1995 that relate to our current expectations and views of future events. We intend such forward-looking statements to be covered by the safe harbor provisions for forward-looking statements contained in Section 27A of the Securities Act and Section 21E of the Exchange Act. AIR Global PLC is the public operating company that resulted from the business combination of AIR Limited with a special purpose acquisition company, which completed in May 2026, and is accordingly not a “blank check company” for purposes of these safe harbor provisions.
Any express or implied statements contained in this press release that are not statements of historical fact may be deemed forward-looking statements, including, without limitation, statements regarding: our FY2026 and FY2027 outlook and medium-term guidance; future results of operations, financial position, shipment volumes, costs and leverage; our capital allocation framework, including dividends, share repurchases and equity free cash flow; our manufacturing footprint, including the planned opening of our Romania factory; potential impairments; the Greentank investment; PMTA applications and the anticipated U.S. launch of Crown Switch and other New Growth Categories products; share count and Earnout Shares; and our business strategy and management’s plans and objectives. Forward-looking statements may include words such as “expect,” “intend,” “plan,” “believe,” “anticipate,” “estimate,” “forecast,” “project,” “target,” “outlook,” “guidance,” “aim,” “potential,” “may,” “could,” “would,” “should,” “will,” “continue,” “on track” and similar expressions.
Any future dividends and share repurchases remain subject to Board approval, available distributable reserves, any required shareholder authority, financial performance, market conditions and applicable legal requirements, and there can be no assurance that they will be made in the amounts or on the timeline described, or at all.
Forward-looking statements are neither promises nor guarantees and involve known and unknown risks and uncertainties that could cause actual results to differ materially, including: supply-chain disruption and higher logistics and raw-material costs, shipment disruptions; dependence on distributors and suppliers; competition and cannibalization; FDA review and authorization of our PMTA applications on the timelines we expect, or at all, and other regulatory change and enforcement; scientific-study outcomes; product development and commercialization; excise taxes and illicit trade; consumer preferences; our indebtedness and our ability to generate sufficient cash flow to reduce leverage and fund dividends and share repurchases; potential asset impairments; dilution; foreign exchange, tariffs, trade policy and general economic conditions; realization of the anticipated benefits of the Greentank investment; tax, legal and accounting developments; our internal control over financial reporting, including previously identified material weaknesses; and the other important factors discussed under the caption “Risk Factors” in our Registration Statement on Form F-1, as amended, filed with the U.S. Securities and Exchange Commission (“SEC”), as such factors may be updated from time to time in our other filings with the SEC, including our Reports on Form 6-K. Any forward-looking statement speaks only as of the date made, and undue reliance should not be placed on such statements. AIR disclaims any obligation to update or revise forward-looking statements except as required by applicable law.
Use of Non-IFRS Financial Measures
This press release includes EBITDA, Adjusted EBITDA, Net Debt and Net Debt to Adjusted EBITDA, each of which is not presented in accordance with IFRS and may differ from similarly titled measures used by other companies.
AIR defines EBITDA as earnings for the period before interest, taxation, depreciation and amortization. The most directly comparable IFRS measure is profit/(loss) for the period. EBITDA is an intermediate step in AIR’s calculation of Adjusted EBITDA.
AIR defines Adjusted EBITDA as earnings before interest, taxes, depreciation and amortization, further adjusted to exclude items such as non-recurring expenses, share-based compensation and other non-operating expenses. AIR believes Adjusted EBITDA assists investors and management in evaluating operating performance consistently, but it should not be considered in isolation or as a substitute for IFRS results.
Adjusted EBITDA does not reflect cash expenditures or capital requirements, working-capital needs, interest or principal payments, cash taxes, or the future replacement of depreciated and amortized assets. Other companies may calculate the measure differently, and management’s adjustments involve judgment. A reconciliation is provided in Appendix C.
AIR defines Net Debt as total borrowings less cash and cash equivalents. AIR defines Net Debt to Adjusted EBITDA as Net Debt divided by Adjusted EBITDA. Neither measure is presented in accordance with IFRS. AIR believes the ratio is useful in assessing capital structure and progress toward target leverage.
No Offer or Solicitation
This press release is for informational purposes only and does not constitute, and shall not be construed as, an offer to sell or the solicitation of an offer to buy any securities of AIR, nor shall there be any sale of securities in any state or jurisdiction in which such offer, solicitation or sale would be unlawful prior to registration or qualification under the securities laws of any such state or jurisdiction.
Contacts
AIR Investor Relations:
Gaurav Jain: Gaurav.jain@air.global; +971-56-439-4296
Anuja Shendye: a.shendye@air.global; +971-58-907-8782
investor@air.global
AIR Media Relations:
ICR for AIR | AIRglobal@icrinc.com
EARNINGS PRESENTATION Q3’26 Results November 12, 2026 Exhibit 99.2
Disclaimer This presentation (this "Presentation") has been prepared by AIR Global PLC ("AIR" or the "Company" and, together with its subsidiaries, the "Group") solely for informational purposes. This Presentation is not being made in connection with any offering of securities and does not constitute or form part of an offer to sell or issue, or a solicitation of an offer to buy or subscribe for, any securities of the Company in any jurisdiction, nor shall it or any part of it form the basis of, or be relied upon in connection with, any contract or investment decision. This Presentation does not constitute a "prospectus" within the meaning of the U.S. Securities Act of 1933, as amended, and there shall be no sale of securities in any jurisdiction in which such offer, solicitation or sale would be unlawful prior to registration or qualification under the securities laws of such jurisdiction. Nothing in this Presentation constitutes investment, legal, tax, accounting or other advice or a recommendation regarding any securities of the Company. The information in this Presentation is a summary only and does not purport to be complete. It should be read together with the Company's filings with the U.S. Securities and Exchange Commission (the "SEC") including its Annual Report on Form 20-F, its registration statement on Form F-1 and its Reports on Form 6-K, which are available at www.sec.gov. In the event of any inconsistency between this Presentation and those filings, the filings will prevail. The information in this Presentation is provided as of the date of this Presentation (unless otherwise indicated), and the Company undertakes no obligation to update it, except as required by law. Forward-Looking Statements. This Presentation contains forward-looking statements within the meaning of the U.S. Private Securities Litigation Reform Act of 1995 that relate to our current expectations and views of future events. We intend such forward-looking statements to be covered by the safe harbor provisions for forward-looking statements as contained in Section 27A of the U.S. Securities Act of 1933, as amended (the "Securities Act"), and Section 21E of the U.S. Securities Exchange Act of 1934, as amended (the "Exchange Act"). AIR Global PLC (NASDAQ: AIIR) is a public operating company that resulted from the business combination of AIR Limited with a special purpose acquisition company, which completed in May 2026, and is accordingly not a "blank check company" for purposes of these safe harbor provisions. Any express or implied statements contained in this Presentation that are not statements of historical fact may be deemed to be forward-looking statements, including, without limitation, statements regarding the Company's financial outlook and medium-term guidance, including expected shipment volumes, revenue, Adjusted EBITDA, effective tax rate and capital expenditure, expected growth, leverage and deleveraging, working capital, capital allocation, including intended dividends and share repurchases, the anticipated benefits of the Greentank investment and the potential exercise of the related warrant, supply chain recovery and the Group's factory reorganization, product development and commercialization, regulatory submissions and approvals, and market trends and opportunities. Words such as "expect," "anticipate," "intend," "plan," "believe," "estimate," "project," "forecast," "outlook," "guidance," "target," "aim," "potential," "continue," "may," "will," "should," "could" and similar expressions identify forward-looking statements. Forward-looking statements are neither promises nor guarantees, are based on management's current expectations and assumptions and are subject to known and unknown risks and uncertainties, many of which are beyond the Company's control, that could cause actual results to differ materially. These include, among others: disruptions to the Company's supply chain and shipments, including as a result of conflict in the Middle East or disruption of the Strait of Hormuz; increases in logistics and raw-material costs; dependence on distributors and suppliers; competition, including from next generation nicotine categories; the timing and outcome of regulatory submissions, including PMTA applications; the results of scientific studies and their acceptance by regulatory authorities; the preliminary nature of the McKinney pilot study data, which is subject to further testing and verification and may change materially as additional data becomes available; the Group's ability to realize the anticipated benefits of the Greentank investment; changes in tobacco and nicotine regulation, excise and taxation; illicit trade; consumer preferences; foreign exchange fluctuations; tariffs, trade policy and general economic conditions; the Group's indebtedness, including the senior notes; the Company's ability to generate sufficient equity free cash flow, and Board approval and legal, regulatory and contractual requirements, which may affect the amount and timing of any dividends or share repurchases; dilution from earnout shares and other equity arrangements; tax, legal and accounting developments; our history of previously identified material weaknesses in internal control over financial reporting; and the other factors described under "Risk Factors" in the Company's Annual Report on Form 20-F, as such factors may be updated from time to time in its other filings with the SEC, including its Reports on Form 6-K. Forward-looking statements made orally by management in connection with this Presentation, including on the related earnings call, are qualified in their entirety by this cautionary statement. You should not place undue reliance on forward-looking statements, which speak only as of the date of this Presentation. The Company disclaims any obligation to update or revise any forward-looking statement, whether as a result of new information, future events or otherwise, except as required by law. No Representations and Warranties. This Presentation is for informational purposes only. No representation or warranty, express or implied, is or will be given by AIR or any of its affiliates, directors, officers, employees or advisers or any other person as to the accuracy or completeness of the information in this Presentation, and no responsibility or liability whatsoever is accepted for the accuracy or sufficiency thereof or for any errors, omissions or misstatements, negligent or otherwise, relating thereto. The information contained in this Presentation is derived from various internal and external sources, is preliminary in nature and is subject to change, and any such changes may be material. Non-IFRS Financial Measures. This Presentation includes certain financial measures not presented in accordance with IFRS as issued by the IASB, including EBITDA, Adjusted EBITDA, Net Debt and Net Debt to Adjusted EBITDA. These measures are supplemental, are not substitutes for IFRS measures, may not be comparable to similarly titled measures used by other companies, and are unaudited. Definitions and reconciliations to the most directly comparable IFRS measures are included in the Glossary and Appendix. No reconciliation is provided for forward-looking non-IFRS measures because the Company cannot do so without unreasonable effort. Industry and Market Data. This Presentation includes market, industry and competitive data and estimates, including data derived from a market assessment report prepared by Arthur D. Little and commissioned by the Company, as well as the Company's internal estimates. These estimates involve assumptions and limitations, are intended as directional indications, and have not been independently verified by the Company. Market share and market size estimates may differ depending on the basis used, including whether they include duty-not-paid or counterfeit products. Such data are subject to change and should not be given undue weight. Third-Party and Market Information. Share prices, trading multiples and analyst estimates included in this Presentation are derived from third-party sources as of the date indicated, have not been verified, adopted or endorsed by the Company, and may not be calculated on a consistent basis. Comparisons with other companies are provided for informational purposes only; those companies differ from the Company in size, products, markets and regulatory profile. Nothing herein is an indication of the value of the Company's securities. Trademarks. This Presentation may contain trademarks, service marks, trade names and copyrights of the Group and of third parties, which are the property of their respective owners. The use of third-party marks does not imply any affiliation with, or endorsement by, those owners. Solely for convenience, some of the trademarks, service marks, trade names and copyrights referred to in this Presentation may be listed without the ™, SM, © or ® symbols, but the Company will assert, to the fullest extent under applicable law, the rights of the applicable owners, if any, to these trademarks, service marks, trade names and copyrights.

Gaurav Jain VP Investor Relations & Corporate Strategy Today’s Speakers Stuart Brazier Chief Executive Officer Bassem Lotfy Chief Financial Officer
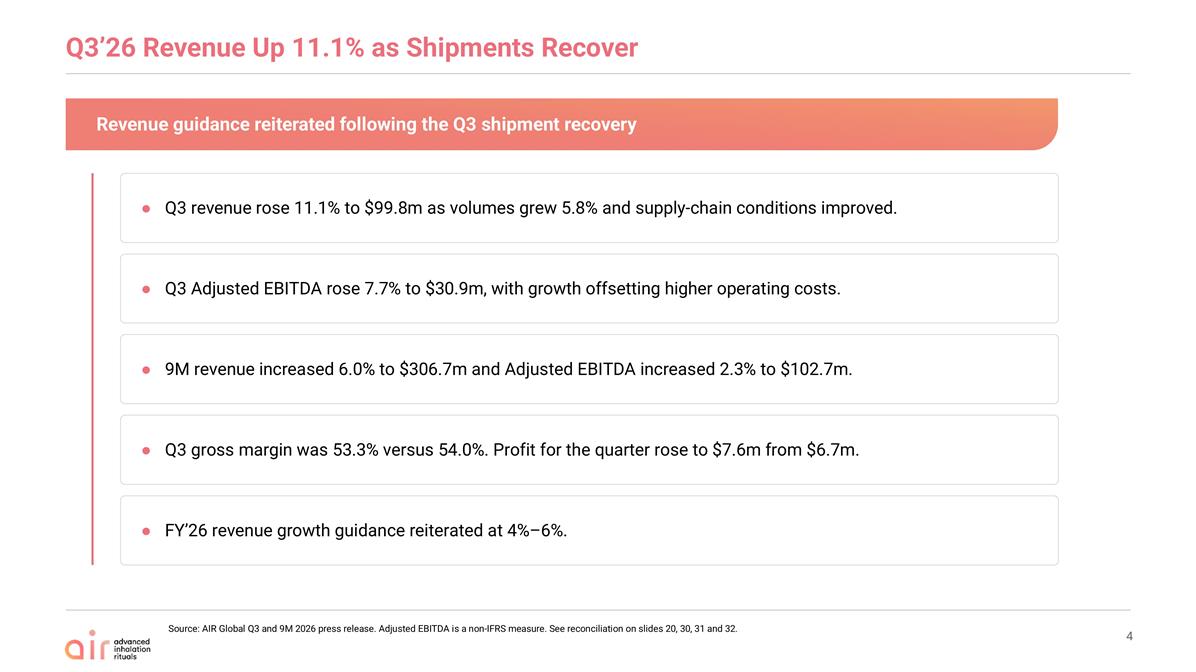
Q3’26 Revenue Up 11.1% as Shipments Recover Source: AIR Global Q3 and 9M 2026 press release. Adjusted EBITDA is a non-IFRS measure. See reconciliation on slides 20, 30, 31 and 32. Revenue guidance reiterated following the Q3 shipment recovery Q3 revenue rose 11.1% to $99.8m as volumes grew 5.8% and supply-chain conditions improved. Q3 Adjusted EBITDA rose 7.7% to $30.9m, with growth offsetting higher operating costs. 9M revenue increased 6.0% to $306.7m and Adjusted EBITDA increased 2.3% to $102.7m. Q3 gross margin was 53.3% versus 54.0%. Profit for the quarter rose to $7.6m from $6.7m. FY’26 revenue growth guidance reiterated at 4%–6%.
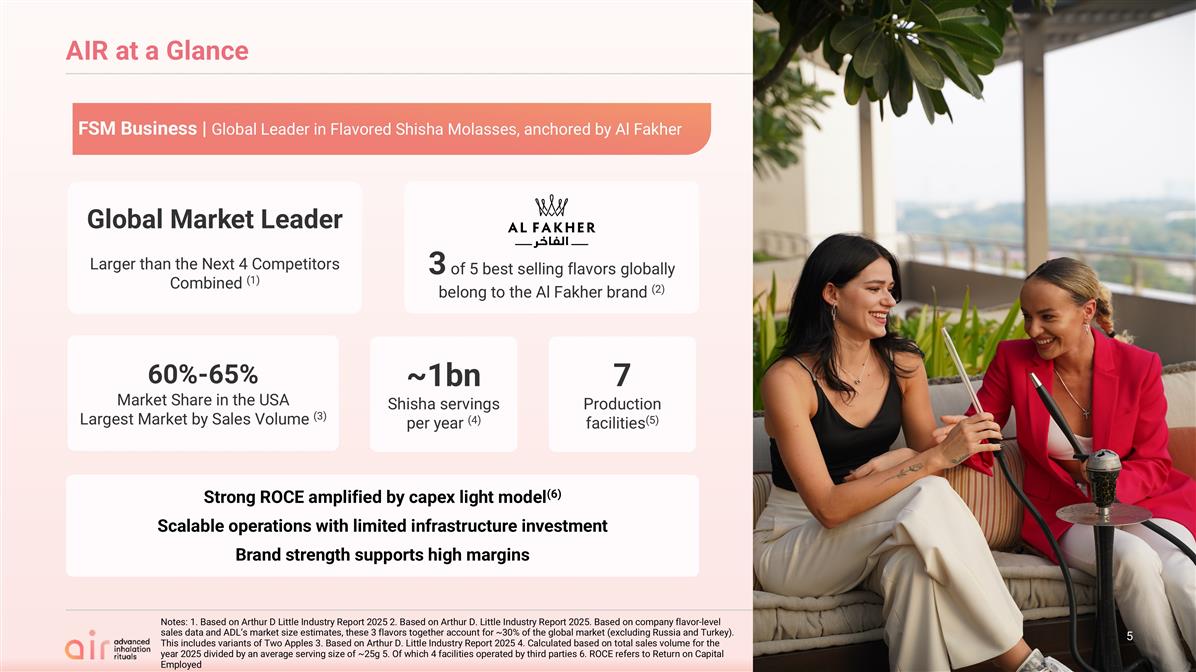
AIR at a Glance Strong ROCE amplified by capex light model(6) Scalable operations with limited infrastructure investment Brand strength supports high margins ~1bn Shisha servings per year (4) 7 Production facilities(5) 60%-65% Market Share in the USA Largest Market by Sales Volume (3) 3 of 5 best selling flavors globally belong to the Al Fakher brand (2) Global Market Leader Larger than the Next 4 Competitors Combined (1) Notes: 1. Based on Arthur D Little Industry Report 2025 2. Based on Arthur D. Little Industry Report 2025. Based on company flavor-level sales data and ADL’s market size estimates, these 3 flavors together account for ~30% of the global market (excluding Russia and Turkey). This includes variants of Two Apples 3. Based on Arthur D. Little Industry Report 2025 4. Calculated based on total sales volume for the year 2025 divided by an average serving size of ~25g 5. Of which 4 facilities operated by third parties 6. ROCE refers to Return on Capital Employed FSM Business | Global Leader in Flavored Shisha Molasses, anchored by Al Fakher
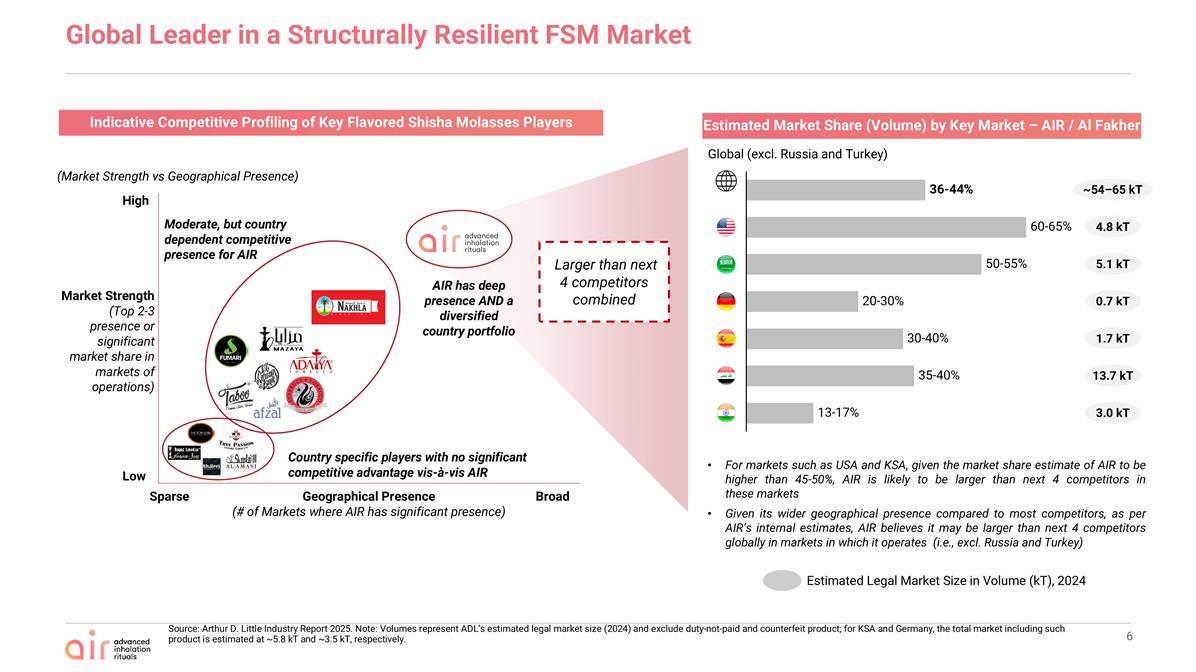
Indicative Competitive Profiling of Key Flavored Shisha Molasses Players Estimated Market Share (Volume) by Key Market – AIR / Al Fakher Source: Arthur D. Little Industry Report 2025. Note: Volumes represent ADL’s estimated legal market size (2024) and exclude duty-not-paid and counterfeit product; for KSA and Germany, the total market including such product is estimated at ~5.8 kT and ~3.5 kT, respectively. (Market Strength vs Geographical Presence) Moderate, but country dependent competitive presence for AIR AIR has deep presence AND a diversified country portfolio Country specific players with no significant competitive advantage vis-à-vis AIR Market Strength (Top 2-3 presence or significant market share in markets of operations) High Low Sparse Broad Geographical Presence (# of Markets where AIR has significant presence) For markets such as USA and KSA, given the market share estimate of AIR to be higher than 45-50%, AIR is likely to be larger than next 4 competitors in these markets Given its wider geographical presence compared to most competitors, as per AIR’s internal estimates, AIR believes it may be larger than next 4 competitors globally in markets in which it operates (i.e., excl. Russia and Turkey) Estimated Legal Market Size in Volume (kT), 2024 4.8 kT 5.1 kT 0.7 kT 1.7 kT 13.7 kT 3.0 kT Larger than next 4 competitors combined Global (excl. Russia and Turkey) 36-44% 60-65% 50-55% 20-30% 30-40% 35-40% 13-17% ~54–65 kT Global Leader in a Structurally Resilient FSM Market
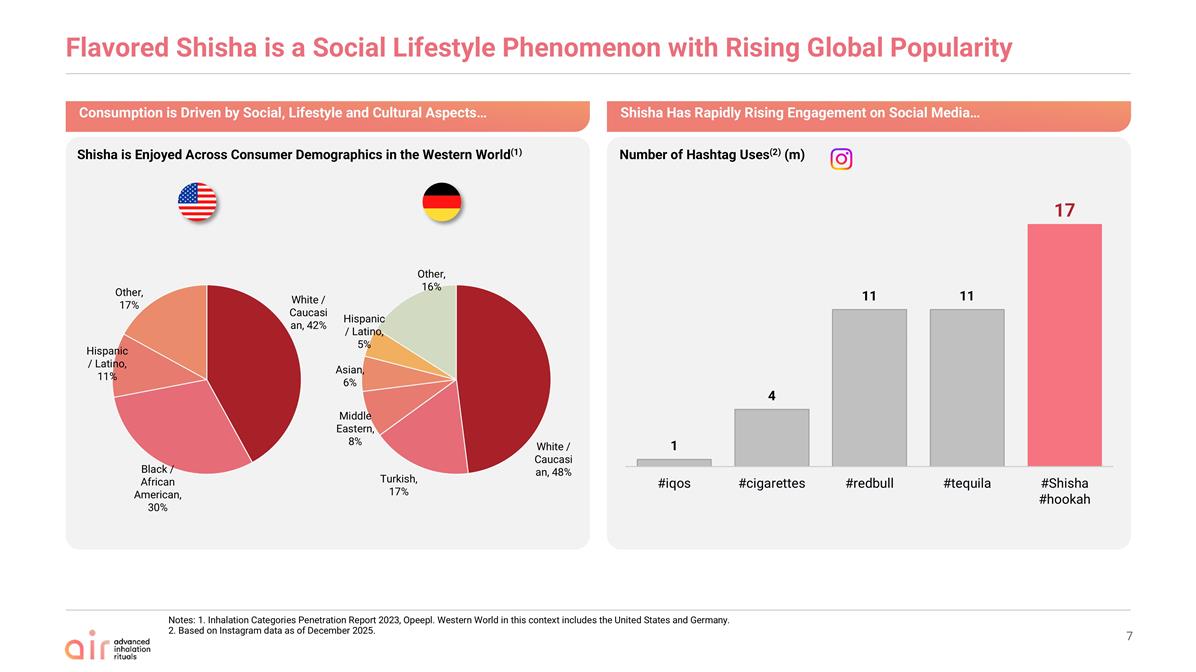
Flavored Shisha is a Social Lifestyle Phenomenon with Rising Global Popularity Consumption is Driven by Social, Lifestyle and Cultural Aspects… Shisha is Enjoyed Across Consumer Demographics in the Western World(1) Notes: 1. Inhalation Categories Penetration Report 2023, Opeepl. Western World in this context includes the United States and Germany. 2. Based on Instagram data as of December 2025. Number of Hashtag Uses(2) (m) Shisha Has Rapidly Rising Engagement on Social Media…
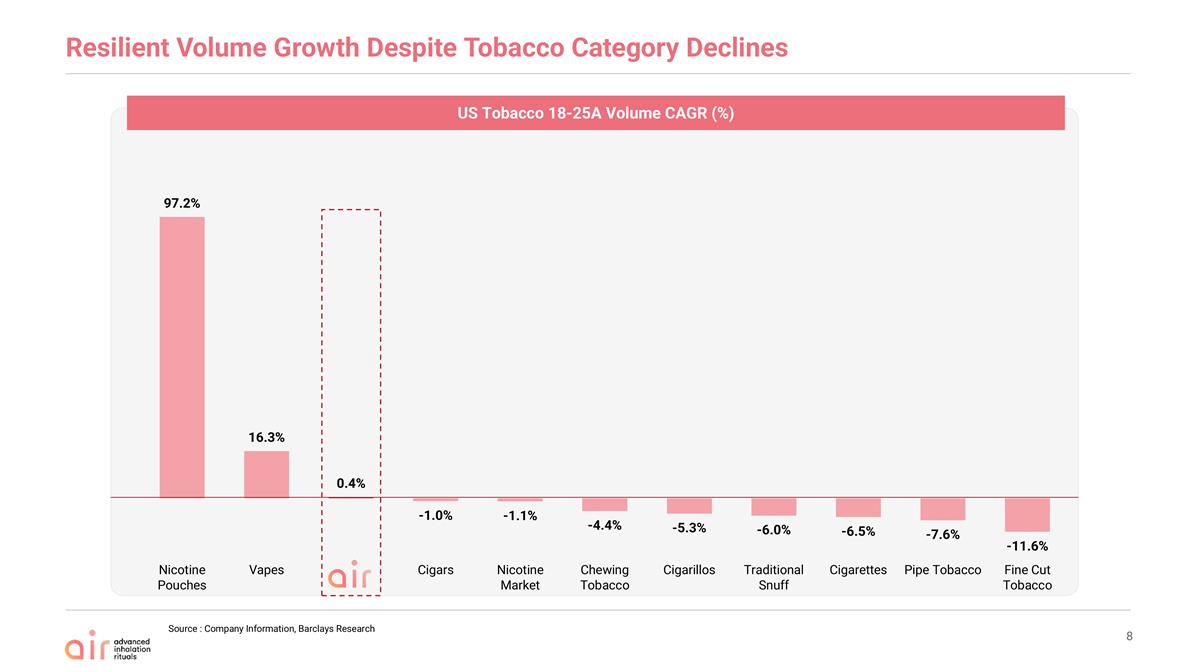
Resilient Volume Growth Despite Tobacco Category Declines Source : Company Information, Barclays Research Fine Cut Tobacco Traditional Snuff Cigarettes Pipe Tobacco Cigarillos Cigars Chewing Tobacco US Tobacco 18-25A Volume CAGR (%) Nicotine Pouches Vapes Nicotine Market
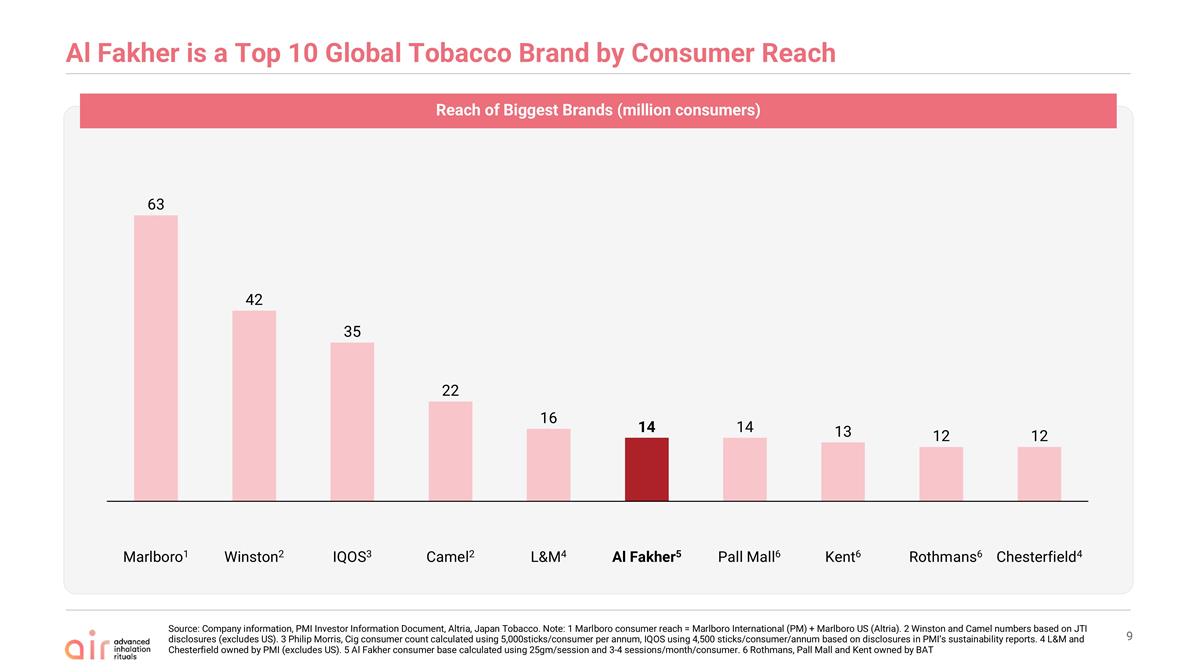
Al Fakher is a Top 10 Global Tobacco Brand by Consumer Reach Source: Company information, PMI Investor Information Document, Altria, Japan Tobacco. Note: 1 Marlboro consumer reach = Marlboro International (PM) + Marlboro US (Altria). 2 Winston and Camel numbers based on JTI disclosures (excludes US). 3 Philip Morris, Cig consumer count calculated using 5,000sticks/consumer per annum, IQOS using 4,500 sticks/consumer/annum based on disclosures in PMI’s sustainability reports. 4 L&M and Chesterfield owned by PMI (excludes US). 5 Al Fakher consumer base calculated using 25gm/session and 3-4 sessions/month/consumer. 6 Rothmans, Pall Mall and Kent owned by BAT Reach of Biggest Brands (million consumers) 1 2 3 2 4 5 6 6 Pall Mall6 4
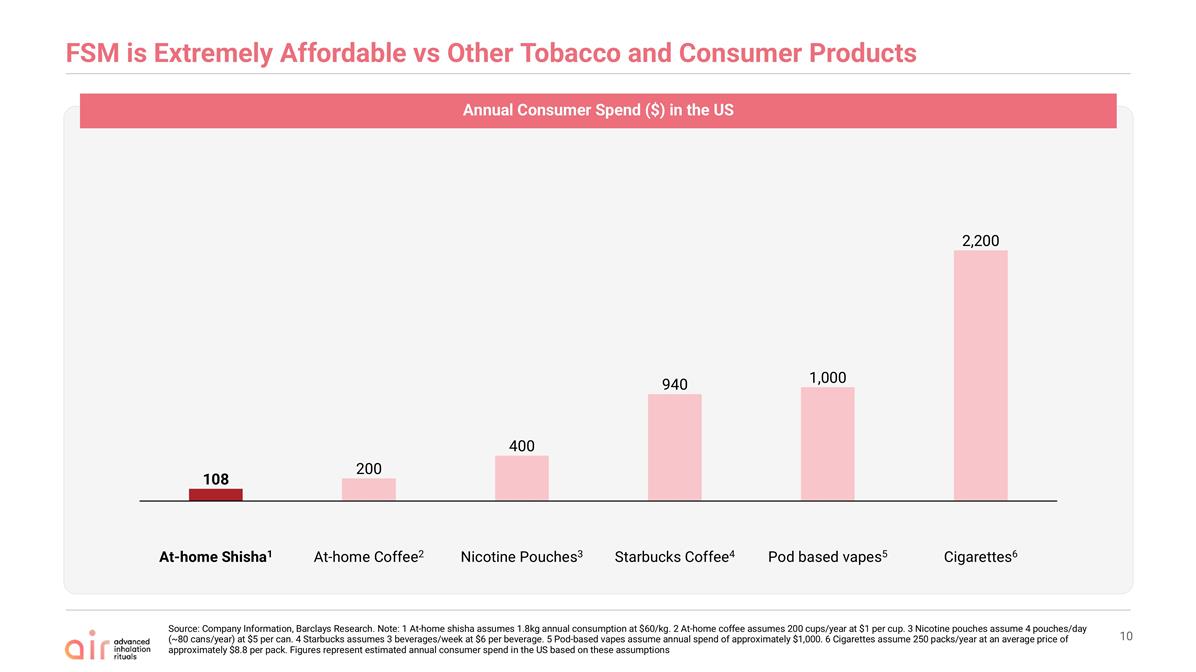
FSM is Extremely Affordable vs Other Tobacco and Consumer Products Source: Company Information, Barclays Research. Note: 1 At-home shisha assumes 1.8kg annual consumption at $60/kg. 2 At-home coffee assumes 200 cups/year at $1 per cup. 3 Nicotine pouches assume 4 pouches/day (~80 cans/year) at $5 per can. 4 Starbucks assumes 3 beverages/week at $6 per beverage. 5 Pod-based vapes assume annual spend of approximately $1,000. 6 Cigarettes assume 250 packs/year at an average price of approximately $8.8 per pack. Figures represent estimated annual consumer spend in the US based on these assumptions Annual Consumer Spend ($) in the US 1 2 3 4 5 6

GREAT TASTE, EVERY PUFF.
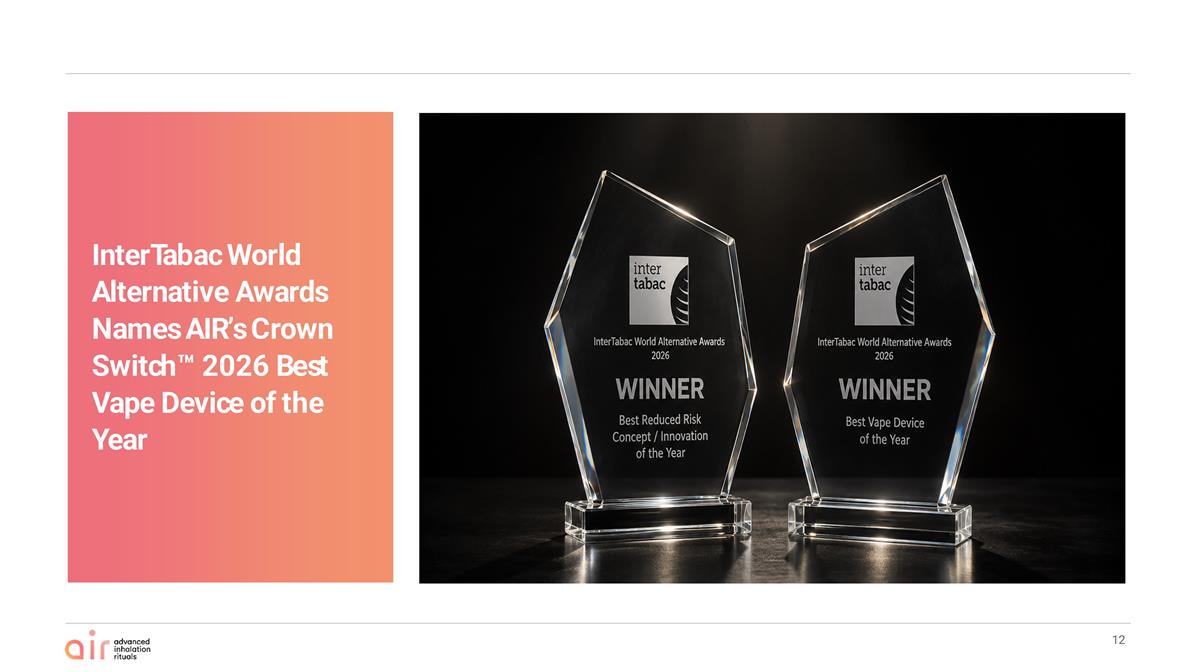
InterTabac World Alternative Awards Names AIR’s Crown Switch™ 2026 Best Vape Device of the Year
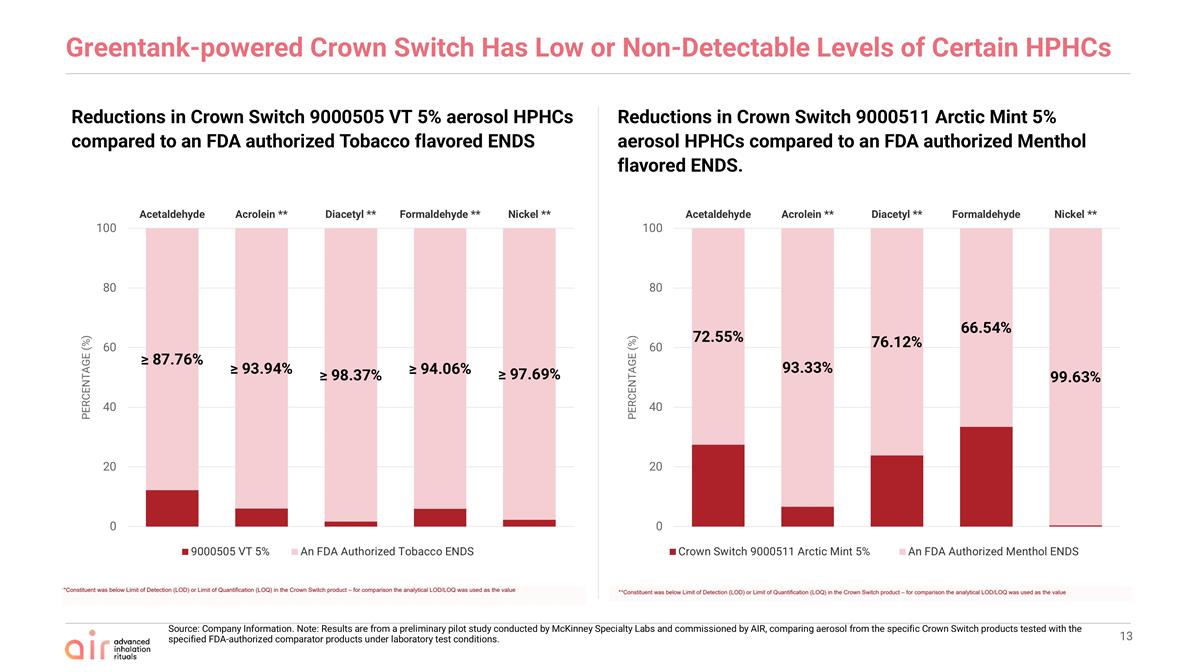
Greentank-powered Crown Switch Has Low or Non-Detectable Levels of Certain HPHCs Source: Company Information. Note: Results are from a preliminary pilot study conducted by McKinney Specialty Labs and commissioned by AIR, comparing aerosol from the specific Crown Switch products tested with the specified FDA-authorized comparator products under laboratory test conditions. Reductions in Crown Switch 9000505 VT 5% aerosol HPHCs compared to an FDA authorized Tobacco flavored ENDS Reductions in Crown Switch 9000511 Arctic Mint 5% aerosol HPHCs compared to an FDA authorized Menthol flavored ENDS.
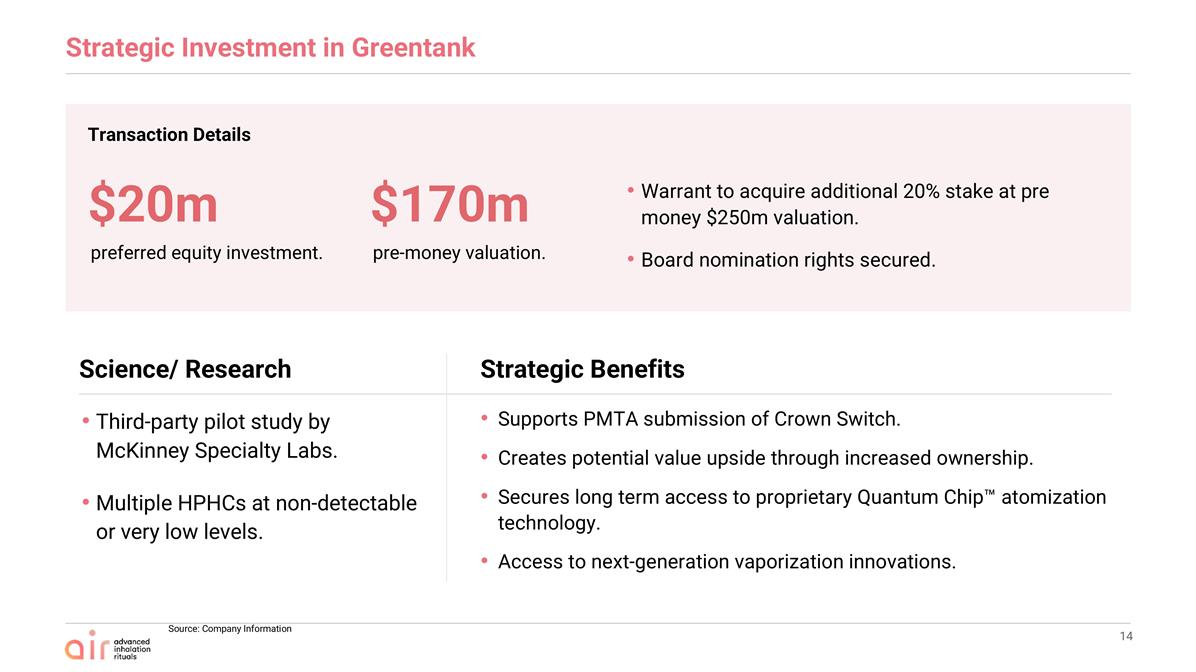
Strategic Investment in Greentank Warrant to acquire additional 20% stake at pre money $250m valuation. Board nomination rights secured. Source: Company Information Third-party pilot study by McKinney Specialty Labs. Multiple HPHCs at non-detectable or very low levels. Supports PMTA submission of Crown Switch. Creates potential value upside through increased ownership. Secures long term access to proprietary Quantum Chip™ atomization technology. Access to next-generation vaporization innovations. Transaction Details Science/ Research Strategic Benefits $20m preferred equity investment. $170m pre-money valuation.

Latest Results
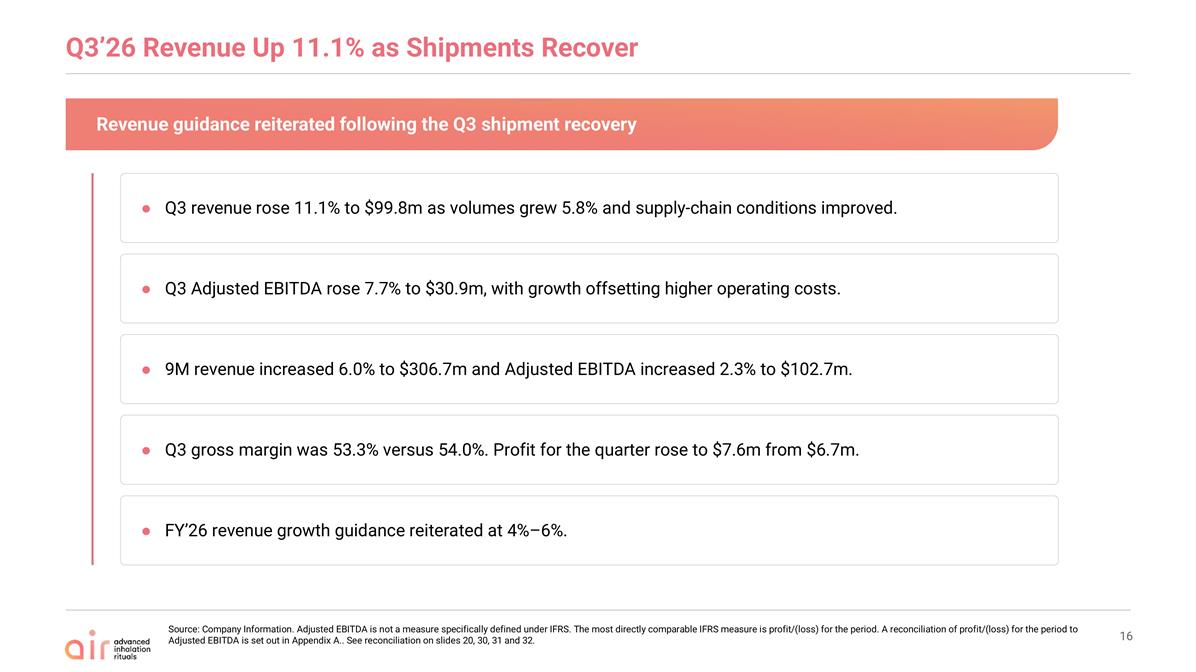
Q3’26 Revenue Up 11.1% as Shipments Recover Source: Company Information. Adjusted EBITDA is not a measure specifically defined under IFRS. The most directly comparable IFRS measure is profit/(loss) for the period. A reconciliation of profit/(loss) for the period to Adjusted EBITDA is set out in Appendix A.. See reconciliation on slides 20, 30, 31 and 32. Revenue guidance reiterated following the Q3 shipment recovery Q3 revenue rose 11.1% to $99.8m as volumes grew 5.8% and supply-chain conditions improved. Q3 Adjusted EBITDA rose 7.7% to $30.9m, with growth offsetting higher operating costs. 9M revenue increased 6.0% to $306.7m and Adjusted EBITDA increased 2.3% to $102.7m. Q3 gross margin was 53.3% versus 54.0%. Profit for the quarter rose to $7.6m from $6.7m. FY’26 revenue growth guidance reiterated at 4%–6%.
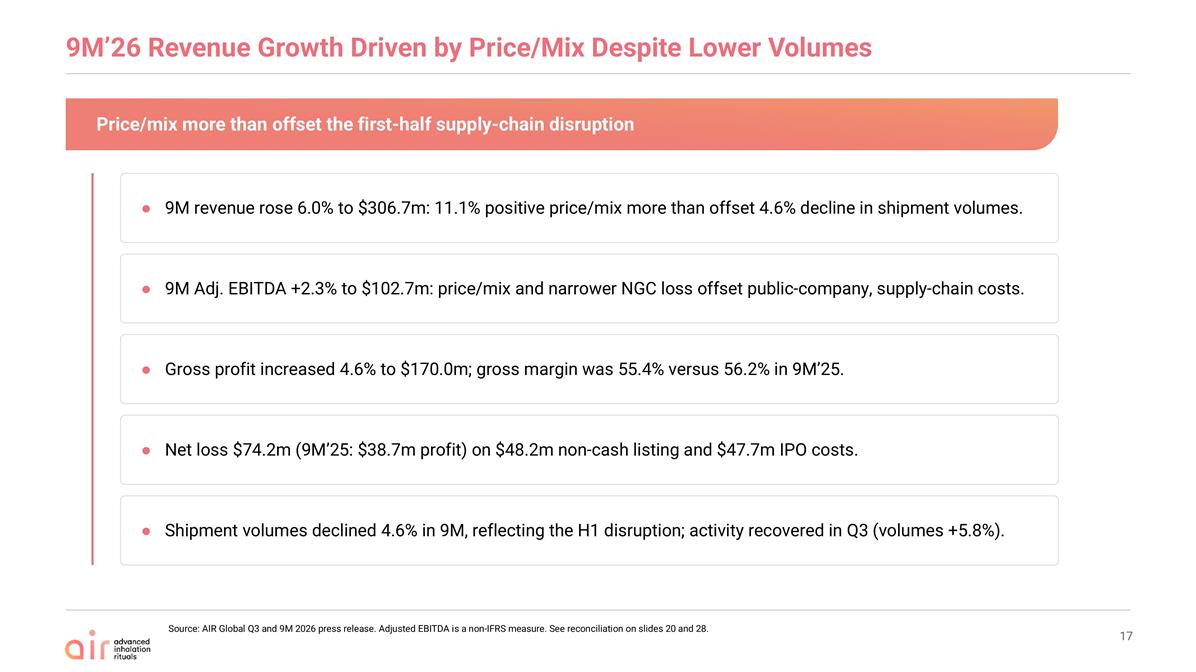
9M’26 Revenue Growth Driven by Price/Mix Despite Lower Volumes Source: AIR Global Q3 and 9M 2026 press release. Adjusted EBITDA is a non-IFRS measure. See reconciliation on slides 20 and 28. Price/mix more than offset the first-half supply-chain disruption 9M revenue rose 6.0% to $306.7m: 11.1% positive price/mix more than offset 4.6% decline in shipment volumes. 9M Adj. EBITDA +2.3% to $102.7m: price/mix and narrower NGC loss offset public-company, supply-chain costs. Gross profit increased 4.6% to $170.0m; gross margin was 55.4% versus 56.2% in 9M’25. Net loss $74.2m (9M’25: $38.7m profit) on $48.2m non-cash listing and $47.7m IPO costs. Shipment volumes declined 4.6% in 9M, reflecting the H1 disruption; activity recovered in Q3 (volumes +5.8%).
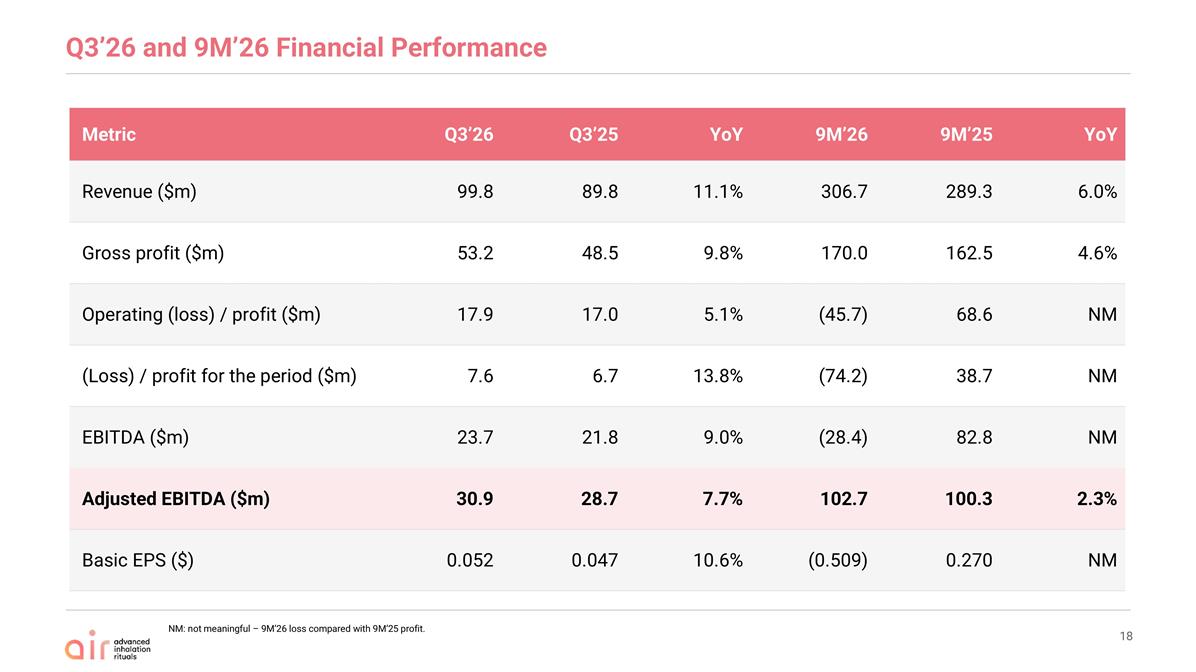
Q3’26 and 9M’26 Financial Performance NM: not meaningful – 9M’26 loss compared with 9M’25 profit. Metric Q3’26 Q3’25 YoY 9M’26 9M’25 YoY Revenue ($m) 99.8 89.8 11.1% 306.7 289.3 6.0% Gross profit ($m) 53.2 48.5 9.8% 170.0 162.5 4.6% Operating (loss) / profit ($m) 17.9 17.0 5.1% (45.7) 68.6 NM (Loss) / profit for the period ($m) 7.6 6.7 13.8% (74.2) 38.7 NM EBITDA ($m) 23.7 21.8 9.0% (28.4) 82.8 NM Adjusted EBITDA ($m) 30.9 28.7 7.7% 102.7 100.3 2.3% Basic EPS ($) 0.052 0.047 10.6% (0.509) 0.270 NM
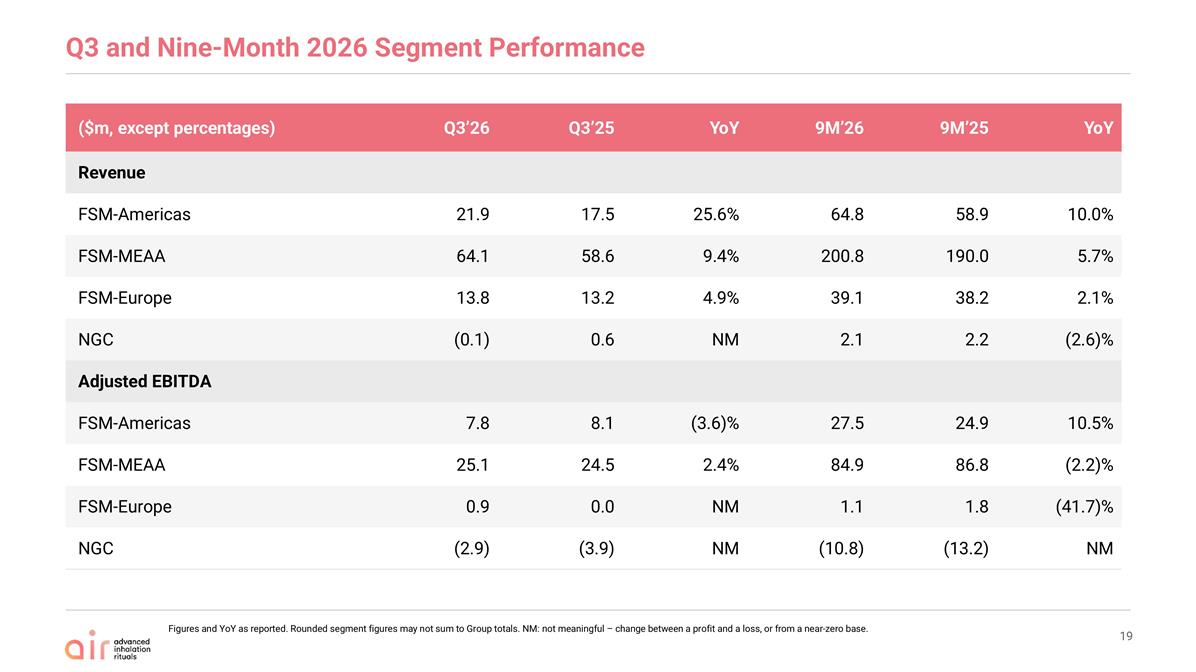
Q3 and Nine-Month 2026 Segment Performance ($m, except percentages) Q3’26 Q3’25 YoY 9M’26 9M’25 YoY Revenue FSM-Americas 21.9 17.5 25.6% 64.8 58.9 10.0% FSM-MEAA 64.1 58.6 9.4% 200.8 190.0 5.7% FSM-Europe 13.8 13.2 4.9% 39.1 38.2 2.1% NGC (0.1) 0.6 NM 2.1 2.2 (2.6)% Adjusted EBITDA FSM-Americas 7.8 8.1 (3.6)% 27.5 24.9 10.5% FSM-MEAA 25.1 24.5 2.4% 84.9 86.8 (2.2)% FSM-Europe 0.9 0.0 NM 1.1 1.8 (41.7)% NGC (2.9) (3.9) NM (10.8) (13.2) NM Figures and YoY as reported. Rounded segment figures may not sum to Group totals. NM: not meaningful – change between a profit and a loss, or from a near-zero base.
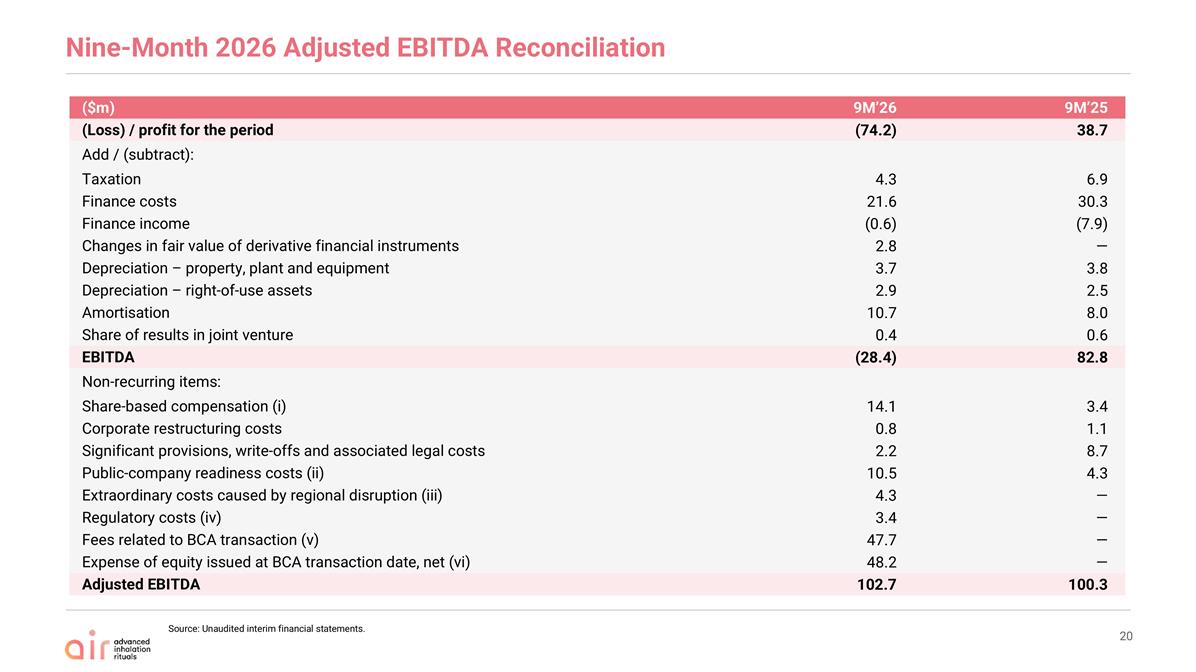
Nine-Month 2026 Adjusted EBITDA Reconciliation ($m) 9M’26 9M’25 (Loss) / profit for the period (74.2) 38.7 Add / (subtract): Taxation 4.3 6.9 Finance costs 21.6 30.3 Finance income (0.6) (7.9) Changes in fair value of derivative financial instruments 2.8 — Depreciation – property, plant and equipment 3.7 3.8 Depreciation – right-of-use assets 2.9 2.5 Amortisation 10.7 8.0 Share of results in joint venture 0.4 0.6 EBITDA (28.4) 82.8 Non-recurring items: Share-based compensation (i) 14.1 3.4 Corporate restructuring costs 0.8 1.1 Significant provisions, write-offs and associated legal costs 2.2 8.7 Public-company readiness costs (ii) 10.5 4.3 Extraordinary costs caused by regional disruption (iii) 4.3 — Regulatory costs (iv) 3.4 — Fees related to BCA transaction (v) 47.7 — Expense of equity issued at BCA transaction date, net (vi) 48.2 — Adjusted EBITDA 102.7 100.3 Source: Unaudited interim financial statements.
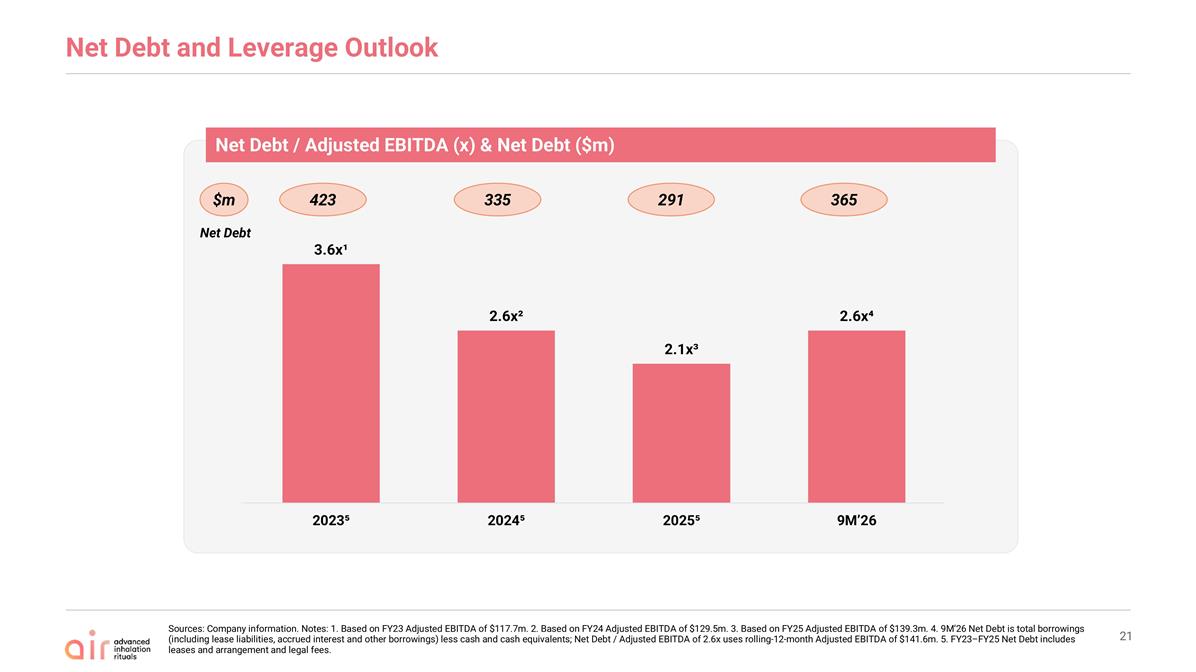
Net Debt and Leverage Outlook Net Debt / Adjusted EBITDA (x) & Net Debt ($m) Sources: Company information. Notes: 1. Based on FY23 Adjusted EBITDA of $117.7m. 2. Based on FY24 Adjusted EBITDA of $129.5m. 3. Based on FY25 Adjusted EBITDA of $139.3m. 4. 9M’26 Net Debt is total borrowings (including lease liabilities, accrued interest and other borrowings) less cash and cash equivalents; Net Debt / Adjusted EBITDA of 2.6x uses rolling-12-month Adjusted EBITDA of $141.6m. 5. FY23–FY25 Net Debt includes leases and arrangement and legal fees. $m 423 335 291 365 Net Debt

Outlook & Guidance
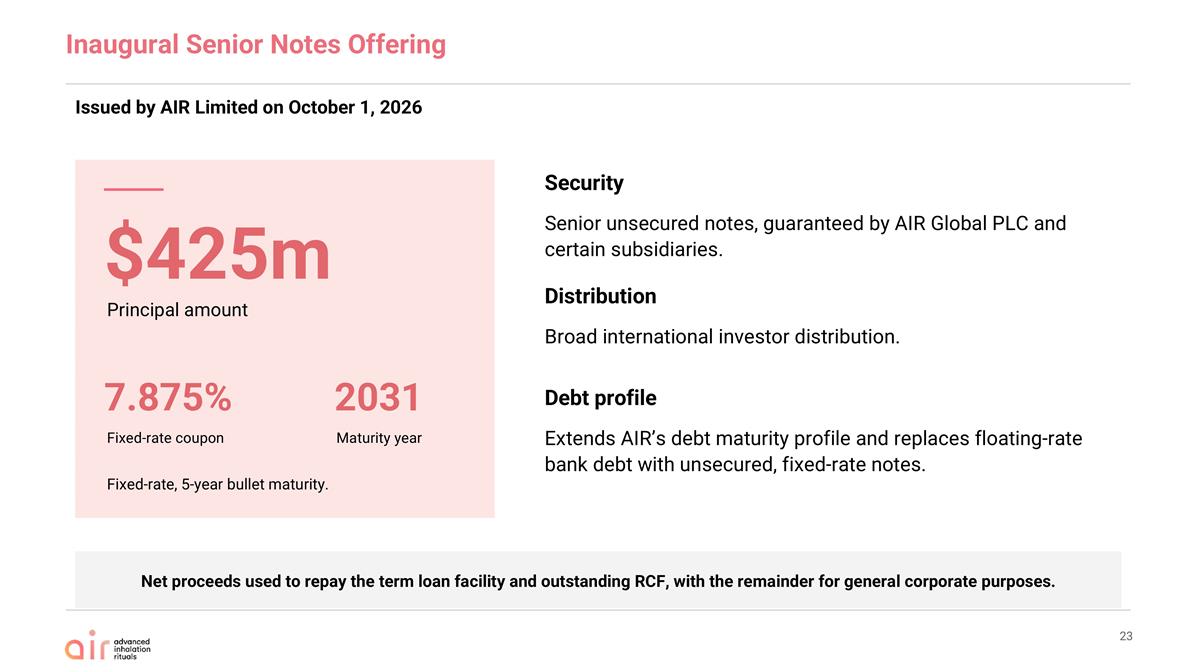
Issued by AIR Limited on October 1, 2026 Inaugural Senior Notes Offering Security Distribution Debt profile Maturity year 7.875% Net proceeds used to repay the term loan facility and outstanding RCF, with the remainder for general corporate purposes. Senior unsecured notes, guaranteed by AIR Global PLC and certain subsidiaries. Fixed-rate, 5-year bullet maturity. Broad international investor distribution. Extends AIR’s debt maturity profile and replaces floating-rate bank debt with unsecured, fixed-rate notes. $425m Principal amount Fixed-rate coupon 2031
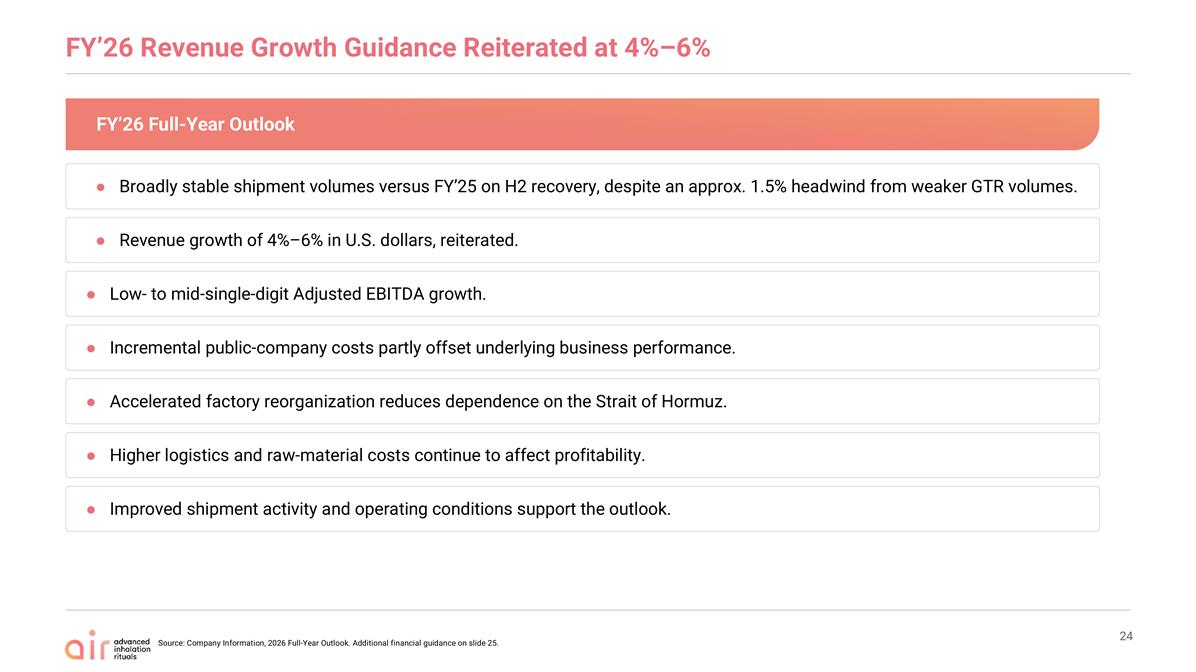
FY’26 Revenue Growth Guidance Reiterated at 4%–6% Broadly stable shipment volumes versus FY’25 on H2 recovery, despite an approx. 1.5% headwind from weaker GTR volumes. Revenue growth of 4%–6% in U.S. dollars, reiterated. Low- to mid-single-digit Adjusted EBITDA growth. Incremental public-company costs partly offset underlying business performance. Accelerated factory reorganization reduces dependence on the Strait of Hormuz. Higher logistics and raw-material costs continue to affect profitability. Improved shipment activity and operating conditions support the outlook. FY’26 Full-Year Outlook Source: Company Information, 2026 Full-Year Outlook. Additional financial guidance on slide 25.
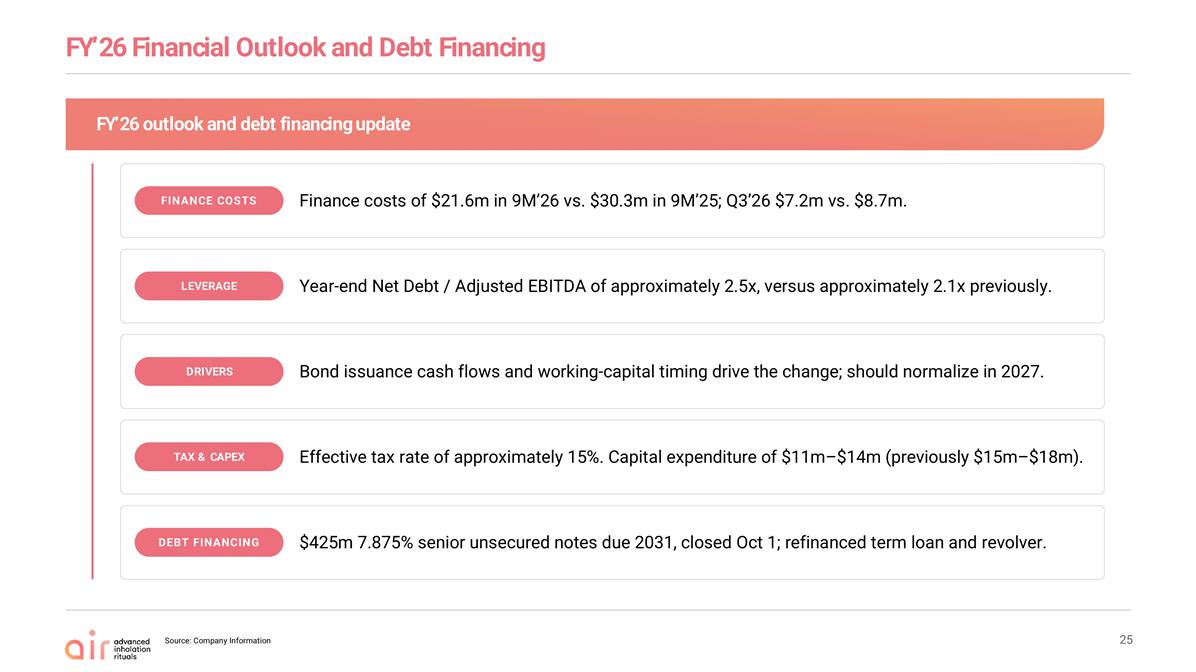
FY’26 Financial Outlook and Debt Financing Finance costs of $21.6m in 9M’26 vs. $30.3m in 9M’25; Q3’26 $7.2m vs. $8.7m. FY’26 outlook and debt financing update FINANCE COSTS Year-end Net Debt / Adjusted EBITDA of approximately 2.5x, versus approximately 2.1x previously. LEVERAGE Bond issuance cash flows and working-capital timing drive the change; should normalize in 2027. DRIVERS Effective tax rate of approximately 15%. Capital expenditure of $11m–$14m (previously $15m–$18m). TAX & CAPEX $425m 7.875% senior unsecured notes due 2031, closed Oct 1; refinanced term loan and revolver. DEBT FINANCING Source: Company Information
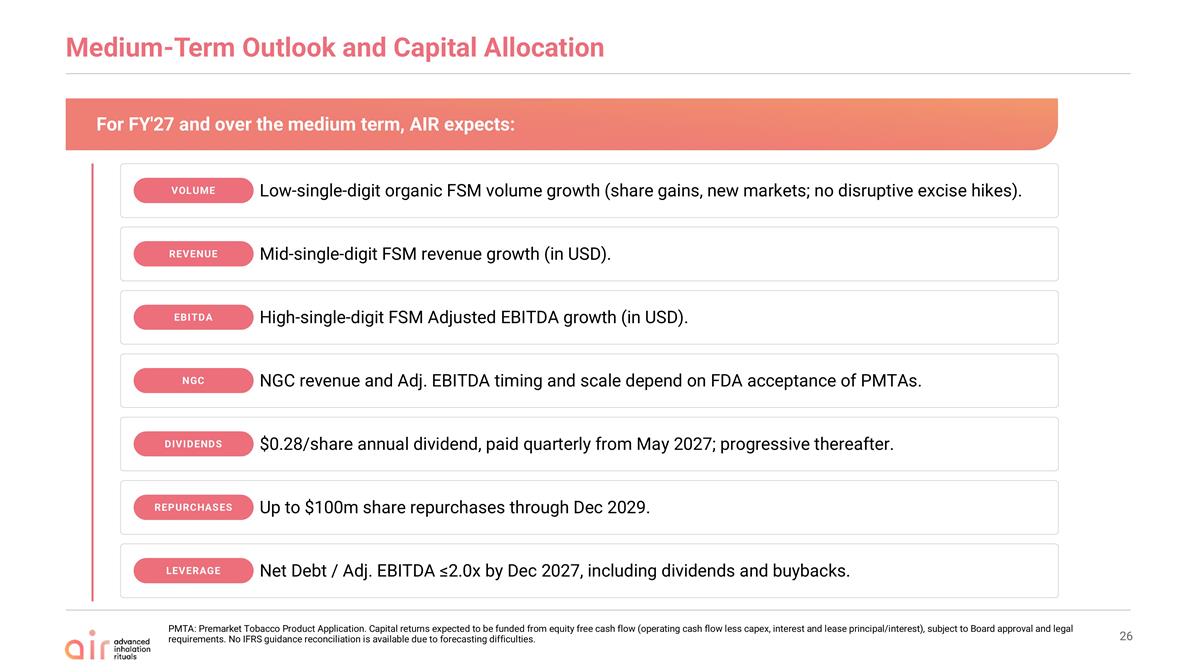
Medium-Term Outlook and Capital Allocation PMTA: Premarket Tobacco Product Application. Capital returns expected to be funded from equity free cash flow (operating cash flow less capex, interest and lease principal/interest), subject to Board approval and legal requirements. No IFRS guidance reconciliation is available due to forecasting difficulties. For FY'27 and over the medium term, AIR expects: Low-single-digit organic FSM volume growth (share gains, new markets; no disruptive excise hikes). VOLUME Mid-single-digit FSM revenue growth (in USD). REVENUE High-single-digit FSM Adjusted EBITDA growth (in USD). EBITDA NGC revenue and Adj. EBITDA timing and scale depend on FDA acceptance of PMTAs. NGC $0.28/share annual dividend, paid quarterly from May 2027; progressive thereafter. DIVIDENDS Net Debt / Adj. EBITDA ≤2.0x by Dec 2027, including dividends and buybacks. LEVERAGE Up to $100m share repurchases through Dec 2029. REPURCHASES
Glossary & Appendix
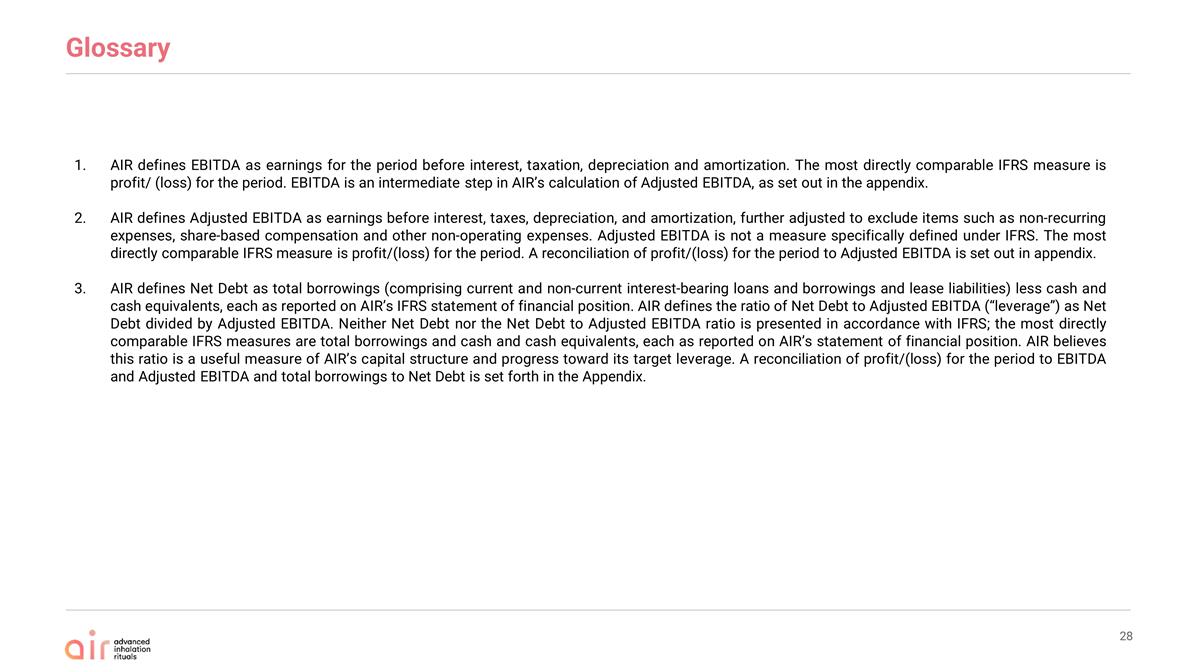
Glossary AIR defines EBITDA as earnings for the period before interest, taxation, depreciation and amortization. The most directly comparable IFRS measure is profit/ (loss) for the period. EBITDA is an intermediate step in AIR’s calculation of Adjusted EBITDA, as set out in the appendix. AIR defines Adjusted EBITDA as earnings before interest, taxes, depreciation, and amortization, further adjusted to exclude items such as non-recurring expenses, share-based compensation and other non-operating expenses. Adjusted EBITDA is not a measure specifically defined under IFRS. The most directly comparable IFRS measure is profit/(loss) for the period. A reconciliation of profit/(loss) for the period to Adjusted EBITDA is set out in appendix. AIR defines Net Debt as total borrowings (comprising current and non-current interest-bearing loans and borrowings and lease liabilities) less cash and cash equivalents, each as reported on AIR’s IFRS statement of financial position. AIR defines the ratio of Net Debt to Adjusted EBITDA (“leverage”) as Net Debt divided by Adjusted EBITDA. Neither Net Debt nor the Net Debt to Adjusted EBITDA ratio is presented in accordance with IFRS; the most directly comparable IFRS measures are total borrowings and cash and cash equivalents, each as reported on AIR’s statement of financial position. AIR believes this ratio is a useful measure of AIR’s capital structure and progress toward its target leverage. A reconciliation of profit/(loss) for the period to EBITDA and Adjusted EBITDA and total borrowings to Net Debt is set forth in the Appendix.
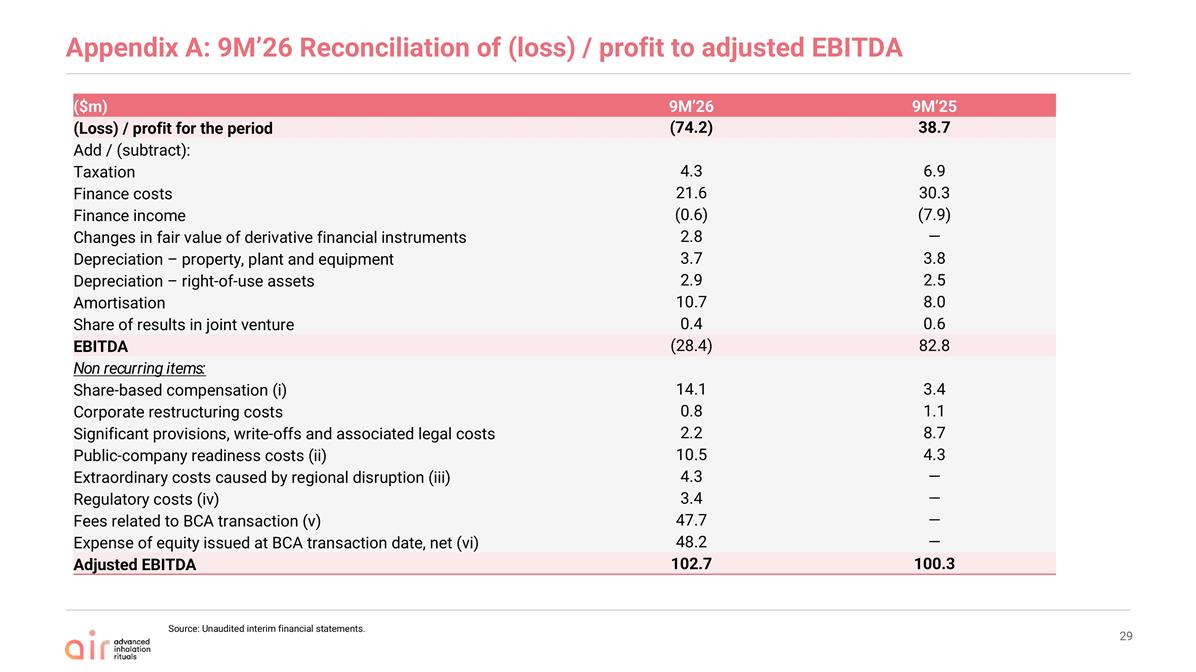
Appendix A: 9M’26 Reconciliation of (loss) / profit to adjusted EBITDA ($m) 9M’26 9M’25 (Loss) / profit for the period (74.2) 38.7 Add / (subtract): Taxation 4.3 6.9 Finance costs 21.6 30.3 Finance income (0.6) (7.9) Changes in fair value of derivative financial instruments 2.8 — Depreciation – property, plant and equipment 3.7 3.8 Depreciation – right-of-use assets 2.9 2.5 Amortisation 10.7 8.0 Share of results in joint venture 0.4 0.6 EBITDA (28.4) 82.8 Non recurring items: Share-based compensation (i) 14.1 3.4 Corporate restructuring costs 0.8 1.1 Significant provisions, write-offs and associated legal costs 2.2 8.7 Public-company readiness costs (ii) 10.5 4.3 Extraordinary costs caused by regional disruption (iii) 4.3 — Regulatory costs (iv) 3.4 — Fees related to BCA transaction (v) 47.7 — Expense of equity issued at BCA transaction date, net (vi) 48.2 — Adjusted EBITDA 102.7 100.3 Source: Unaudited interim financial statements.
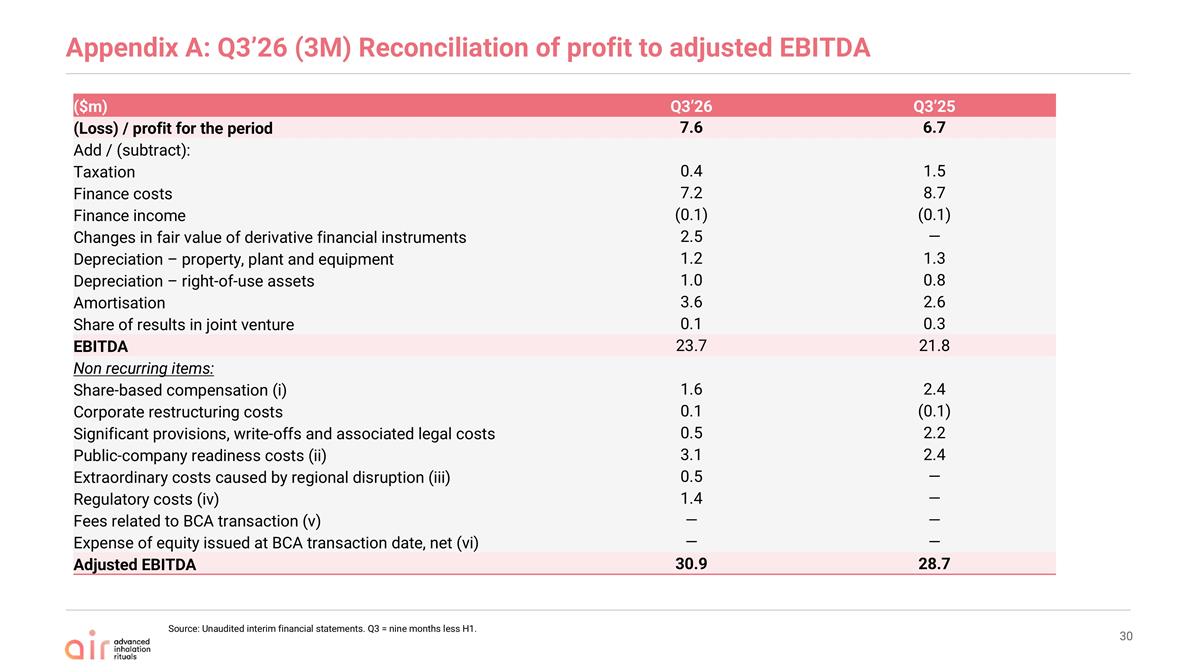
Appendix A: Q3’26 (3M) Reconciliation of profit to adjusted EBITDA ($m) Q3’26 Q3’25 (Loss) / profit for the period 7.6 6.7 Add / (subtract): Taxation 0.4 1.5 Finance costs 7.2 8.7 Finance income (0.1) (0.1) Changes in fair value of derivative financial instruments 2.5 — Depreciation – property, plant and equipment 1.2 1.3 Depreciation – right-of-use assets 1.0 0.8 Amortisation 3.6 2.6 Share of results in joint venture 0.1 0.3 EBITDA 23.7 21.8 Non recurring items: Share-based compensation (i) 1.6 2.4 Corporate restructuring costs 0.1 (0.1) Significant provisions, write-offs and associated legal costs 0.5 2.2 Public-company readiness costs (ii) 3.1 2.4 Extraordinary costs caused by regional disruption (iii) 0.5 — Regulatory costs (iv) 1.4 — Fees related to BCA transaction (v) — — Expense of equity issued at BCA transaction date, net (vi) — — Adjusted EBITDA 30.9 28.7 Source: Unaudited interim financial statements. Q3 = nine months less H1.
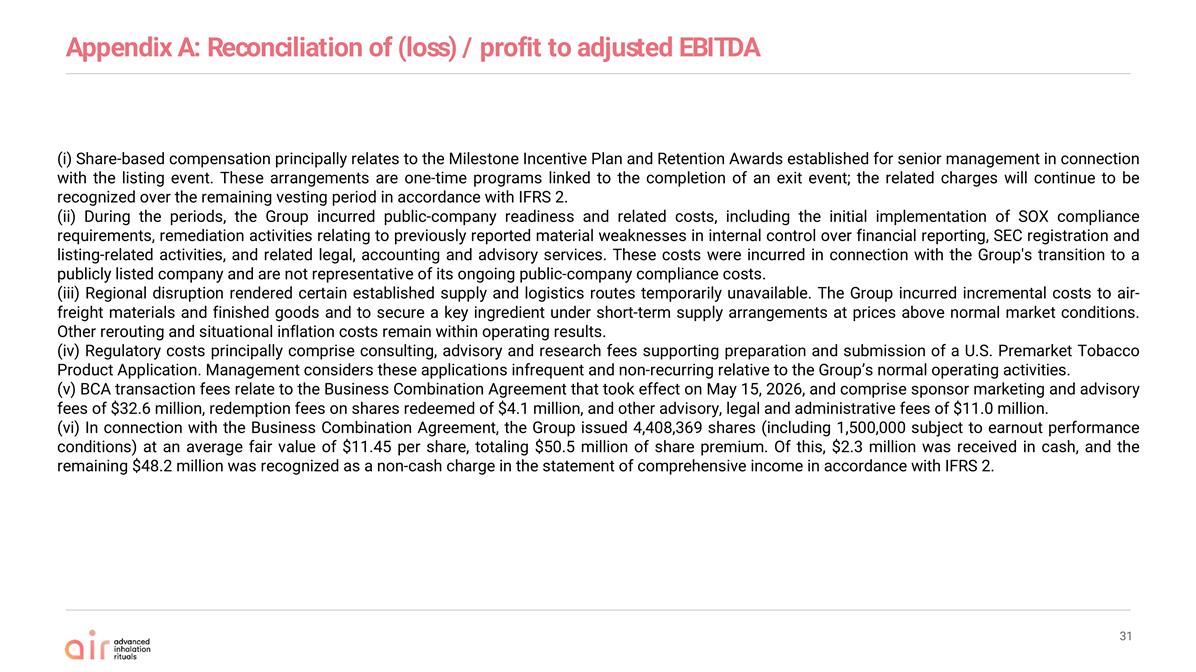
Appendix A: Reconciliation of (loss) / profit to adjusted EBITDA (i) Share-based compensation principally relates to the Milestone Incentive Plan and Retention Awards established for senior management in connection with the listing event. These arrangements are one-time programs linked to the completion of an exit event; the related charges will continue to be recognized over the remaining vesting period in accordance with IFRS 2. (ii) During the periods, the Group incurred public-company readiness and related costs, including the initial implementation of SOX compliance requirements, remediation activities relating to previously reported material weaknesses in internal control over financial reporting, SEC registration and listing-related activities, and related legal, accounting and advisory services. These costs were incurred in connection with the Group's transition to a publicly listed company and are not representative of its ongoing public-company compliance costs. (iii) Regional disruption rendered certain established supply and logistics routes temporarily unavailable. The Group incurred incremental costs to air-freight materials and finished goods and to secure a key ingredient under short-term supply arrangements at prices above normal market conditions. Other rerouting and situational inflation costs remain within operating results. (iv) Regulatory costs principally comprise consulting, advisory and research fees supporting preparation and submission of a U.S. Premarket Tobacco Product Application. Management considers these applications infrequent and non-recurring relative to the Group’s normal operating activities. (v) BCA transaction fees relate to the Business Combination Agreement that took effect on May 15, 2026, and comprise sponsor marketing and advisory fees of $32.6 million, redemption fees on shares redeemed of $4.1 million, and other advisory, legal and administrative fees of $11.0 million. (vi) In connection with the Business Combination Agreement, the Group issued 4,408,369 shares (including 1,500,000 subject to earnout performance conditions) at an average fair value of $11.45 per share, totaling $50.5 million of share premium. Of this, $2.3 million was received in cash, and the remaining $48.2 million was recognized as a non-cash charge in the statement of comprehensive income in accordance with IFRS 2.
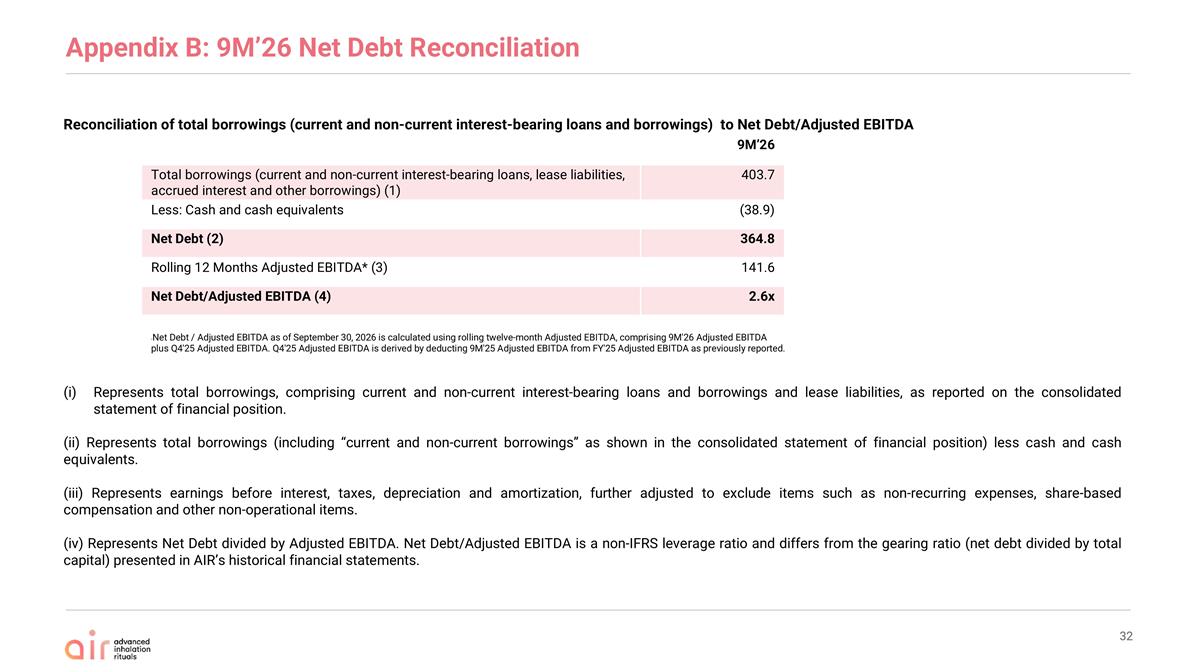
Appendix B: 9M’26 Net Debt Reconciliation Reconciliation of total borrowings (current and non-current interest-bearing loans and borrowings) to Net Debt/Adjusted EBITDA Represents total borrowings, comprising current and non-current interest-bearing loans and borrowings and lease liabilities, as reported on the consolidated statement of financial position. (ii) Represents total borrowings (including “current and non-current borrowings” as shown in the consolidated statement of financial position) less cash and cash equivalents. (iii) Represents earnings before interest, taxes, depreciation and amortization, further adjusted to exclude items such as non-recurring expenses, share-based compensation and other non-operational items. (iv) Represents Net Debt divided by Adjusted EBITDA. Net Debt/Adjusted EBITDA is a non-IFRS leverage ratio and differs from the gearing ratio (net debt divided by total capital) presented in AIR’s historical financial statements. 9M’26 Total borrowings (current and non-current interest-bearing loans, lease liabilities, accrued interest and other borrowings) (1) 403.7 Less: Cash and cash equivalents (38.9) Net Debt (2) 364.8 Rolling 12 Months Adjusted EBITDA* (3) 141.6 Net Debt/Adjusted EBITDA (4) 2.6x *Net Debt / Adjusted EBITDA as of September 30, 2026 is calculated using rolling twelve-month Adjusted EBITDA, comprising 9M'26 Adjusted EBITDA plus Q4'25 Adjusted EBITDA. Q4'25 Adjusted EBITDA is derived by deducting 9M'25 Adjusted EBITDA from FY'25 Adjusted EBITDA as previously reported.
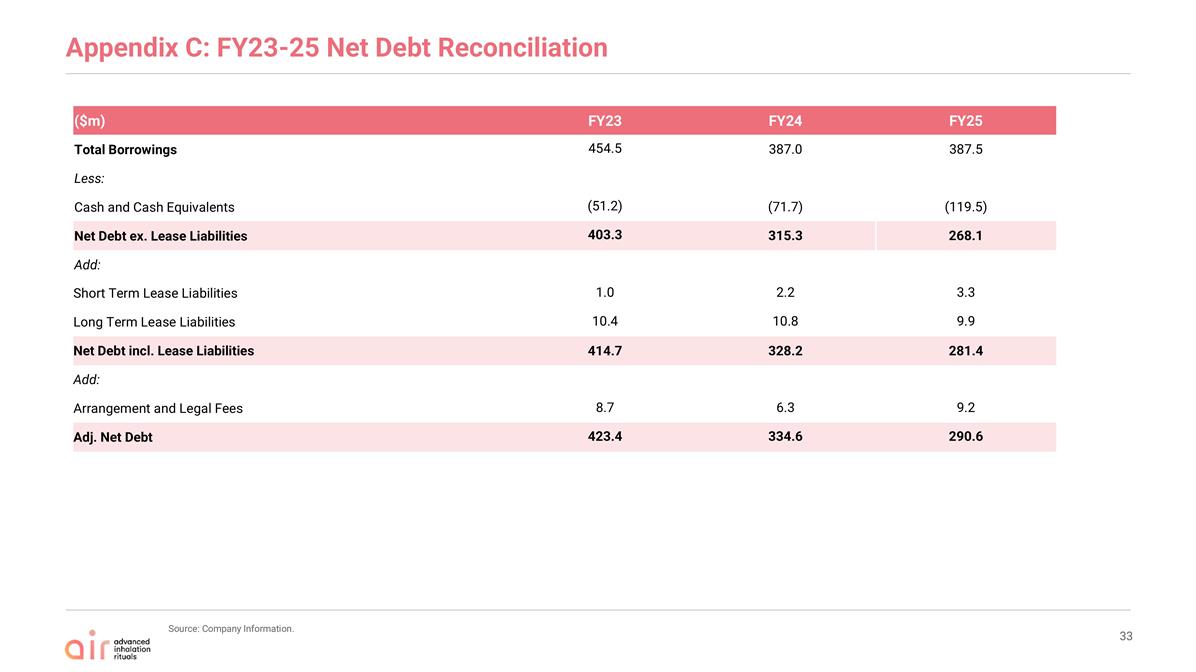
Appendix C: FY23-25 Net Debt Reconciliation ($m) FY23 FY24 FY25 Total Borrowings 454.5 387.0 387.5 Less: Cash and Cash Equivalents (51.2) (71.7) (119.5) Net Debt ex. Lease Liabilities 403.3 315.3 268.1 Add: Short Term Lease Liabilities 1.0 2.2 3.3 Long Term Lease Liabilities 10.4 10.8 9.9 Net Debt incl. Lease Liabilities 414.7 328.2 281.4 Add: Arrangement and Legal Fees 8.7 6.3 9.2 Adj. Net Debt 423.4 334.6 290.6 Source: Company Information.
Exhibit 99.3
Shareholder Letter
AIR Global PLC is a unique company with no direct comparable in its Flavored Shisha Molasses (“FSM”) business. The purpose of this shareholder letter, and the ones that will follow each quarter, is to help investors better understand the company, its categories and the factors driving our performance.
This shareholder letter is structured in a Q&A format to address the key questions investors may have following our third-quarter results.
Question 1: AIR has filed the PMTA for Crown Switch, and it seems that vapes have become the NGC focus of your company. You had announced the launch of several nicotine pouch products earlier last year, and now it seems they are not the focus. This is contrary to what all your peers are doing, who are investing heavily in nicotine pouches given the attractive growth characteristics of that market. Is that perception correct?
We are very bullish on the long-term growth trajectory of all the Next Generation Categories/Reduced Risk Products in the tobacco industry as there are still close to 1bn smokers (including China) in the world, and we believe a significant proportion may transition to NGCs over the next two decades. There are three reasons why we have chosen to prioritize vapes over nicotine pouches:
| • |
First, we think that we need to focus and prioritize our resources given our size relative to our larger tobacco competitors. |
| • |
Second, per management estimates, the near-term profitability trajectory of vapes and nicotine pouches is going in opposite directions. Indeed, based on recent results, we understand that the industry leader in US nicotine pouches is guiding to losses in US nicotine pouches in Q4’26, which we think reflects heightened investment in that category by all players, leading to price compression. By contrast, per management estimates, the industry leader in the US rechargeable pod vape market is operating at 40%+ (and growing) EBIT margins. Due to the crackdown on illicit vapes in the US, we think the US rechargeable pod vape market is becoming less competitive and, according to our estimates, could grow at a mid-teens revenue CAGR over the next few years with attractive economics. |
Long-term, we do expect the US nicotine pouch market to rationalize and consolidate and generate attractive margins. So, we continue to pursue new innovations within nicotine pouches. It is when we have a truly differentiated product in nicotine pouches that we believe we would have a right to win.
| • |
Third, with Crown Switch, which has been developed using Greentank’s Quantum Chip technology, we think we have a differentiated vape product that can be commercially successful. We note that the Crown brand is already successful in the vape market. 4% of our 2025 revenues were generated through our licensing partnership in the disposable vape market on Al Fakher Crown Bar. Extending traditional tobacco brands into vape products isn’t straightforward, but we have a successful brand extension with Al Fakher Crown Bar. |
We do not aim to run an NGC business that, while contributing to revenue, generates little/negative EBITDA perpetually. We aim to take a disciplined approach to future growth. We have submitted the Crown Switch PMTA, and we intend to invest selectively in New Growth Categories, with a focus on generating attractive returns on capital.
Crown Switch has also received encouraging external recognition, having recently been named 2026 Best Vape Device of the Year at the InterTabac World Alternative Awards. We believe this award provides further support for the product’s appeal as we prepare for commercialization.

Question 2: Several global consumer MNCs including tobacco companies are highlighting higher costs due to the conflict in the Middle East in Q4’26 as well as potentially 2027. What is your cost outlook?
Higher energy, shipping, insurance, security and raw-material costs linked to the conflict in the Middle East are affecting our industry, and AIR is no exception. We continue to face a prolonged period of higher costs in the Middle East. That is why we are seeing modest margin compression in 2026. It is also leading to higher working capital investment, which is one of the reasons why our expected leverage at YE2026 is now higher than what we expected when we reported Q2 2026 results in mid-August. We are mitigating these costs through alternative shipping routes, the accelerated reorganization of our factory footprint and pricing actions. If and when costs such as shipping normalize, which we believe historical patterns suggest they may, we expect AIR to capture the majority of these cost savings.
Question 3: How can Al Fakher’s global scale help AIR accelerate growth in Crown Switch?
Al Fakher already reaches an estimated 14 million consumers globally and over 1mn annually in the US. By consumer reach, it is the sixth largest tobacco brand in the world (ex-China). That gives AIR something particularly valuable as we expand into Crown Switch: an established consumer base and strong brand recognition. Of course, brand strength alone does not guarantee success. Regulatory approvals, consumer adoption and disciplined commercial execution will determine how quickly we can scale.
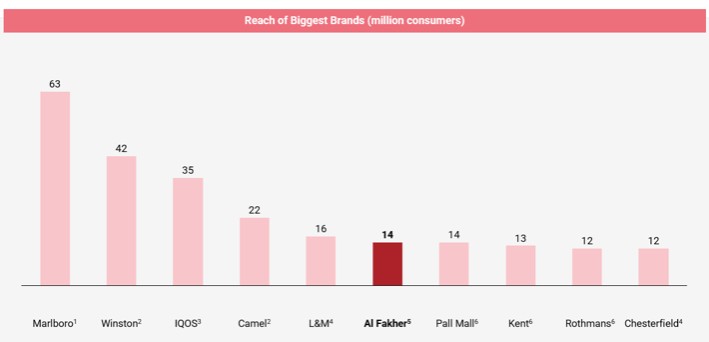
Source: Company information, PMI Investor Information Document, Altria, Japan Tobacco. Notes: (1) Marlboro consumer reach = Marlboro International (PMI) + Marlboro US (Altria). (2) Winston and Camel numbers based on JTI disclosures (excludes US). (3) Philip Morris cigarette consumer count calculated using 5,000 sticks/consumer per annum; IQOS using 4,500 sticks/consumer/annum, based on disclosures in PMI’s sustainability reports. (4) L&M and Chesterfield owned by PMI (excludes US). (5) Al Fakher consumer base calculated using 25gm/session and 3-4 sessions/month/consumer. (6) Rothmans, Pall Mall and Kent owned by BAT.
Consumer figures are estimates based on different consumption assumptions across brands and should therefore be viewed as directional rather than directly comparable.
Question 4: Germany’s Bundestag has approved phased excise-tax increases affecting waterpipe tobacco from March 2027. What does this mean for AIR and the outlook for Europe?
The final Bundestag outcome is significantly better than the original proposal. Earlier discussions contemplated waterpipe-tobacco excise of up to approximately €195 per kilogram by 2030. The adopted amendment delays implementation until March 1, 2027, and now stipulates rates of €60 per kilogram in 2027, €71 in 2028, €82.50 in 2029 and €94.50 in 2030.
The increase is therefore lower, more gradual and later than first proposed, giving the industry more time to adapt. We continue to review the final legislation and its implementation.
Al Fakher currently retails at approximately €145 per kilogram in Germany, which helps put the initial increase of approximately €11 per kilogram into context. Even so, higher prices can reduce legal-market volumes and encourage illicit consumption. We prefer stable or moderate excise increases. Europe is therefore likely to remain challenging, while the United States remains AIR’s main growth driver.
Question 5: How is AIR performing in Saudi Arabia, and how do nicotine-pouch developments affect the market opportunity?
Saudi Arabia is Al Fakher’s second largest market by revenue based on 9M’26. Based on our latest retail audit, we estimate that Al Fakher’s share of the Saudi FSM market is approximately 50% and has been stable over the last few years. We believe this reflects the strength of the brand and resilient consumer demand.
Nicotine pouches have grown rapidly in Saudi Arabia, which is now one of the world’s largest nicotine pouch markets, supported by increasing adult-consumer interest and a leading PIF-backed market participant with significant local scale. This demonstrates how rapidly reduced-risk nicotine categories can develop when regulation with strict enforcement, distribution and consumer demand are aligned.
Our immediate priority remains strengthening Al Fakher’s leadership in FSM. We continue to monitor the nicotine-pouch category in Saudi, but currently the market remains closed to new competition. Besides, we only plan to participate when we have a differentiated product that gives us the right to win and long-term attractive economics.
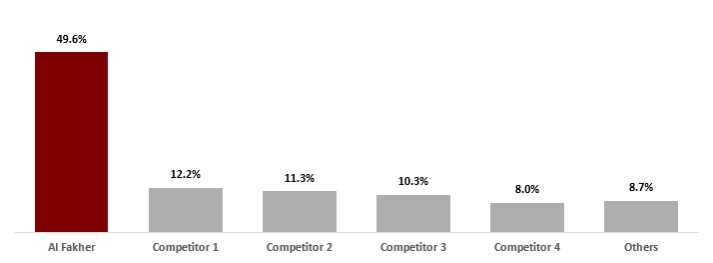
Note: Market share data as of September 2026, covering Jeddah, Dammam, Riyadh. Competitors are shown anonymously; “Others” represents all remaining brands. Percentages are rounded and may not sum to 100%.
Question 6: The 2026 YTD results have a lot of one-off items. Is AIR going to be one of those companies that have a significant difference between adjusted and reported numbers?
As a Nasdaq-listed company, AIR prepares its financial statements in accordance with IFRS as issued by the IASB, its annual financial statements are audited in accordance with the standards of the PCAOB, and AIR is subject to the requirements of the SEC in respect of any non-IFRS financial measures AIR publishes. In keeping with the foregoing, AIR intends to report earnings of the highest quality and to present adjusted numbers that, we believe, together with our IFRS results, better reflect the underlying operating performance of the business. AIR completed its listing on Nasdaq in May 2026. Listing-related adjustments, comprising the non-cash equity issuance expense, BCA transaction fees and public-company readiness costs, total $106.3 million. The key adjusting items in 9M’26 are:
| • |
$48.2 million of non-cash listing expense in accordance with IFRS 2, relating to equity issued in connection with the business combination; |
| • |
$47.7 million of IPO-related cash costs; |
| • |
$10.5 million of other public company readiness costs; |
| • |
$4.3 million of supply chain-related costs resulting from the Strait of Hormuz disruption; |
| • |
$3.4 million of costs relating to the acceleration of PMTA filings in the US following changed FDA enforcement guidance on nicotine vapes and pouches. |
| • |
$14.1 million of non-cash share-based compensation expense. |
In addition, we also have $10.7 million of intangible amortization. This is partly linked to past acquisitions, where cash has already largely been paid out.
We present Adjusted EBITDA to help investors assess AIR’s underlying operating performance separately from items that are non-cash, associated with the listing and refinancing, not expected to recur regularly, or outside normal operations. Adjusted EBITDA is not a substitute for IFRS results or cash flow. Investors should consider both measures alongside cash generation, leverage and the expected reduction in exceptional costs as AIR moves beyond its listing and refinancing activity.
Forward-Looking Statements
This shareholder letter contains forward-looking statements within the meaning of the U.S. Private Securities Litigation Reform Act of 1995 that relate to our current expectations and views of future events. We intend such forward-looking statements to be covered by the safe harbor provisions for forward-looking statements contained in Section 27A of the Securities Act and Section 21E of the Exchange Act. AIR Global PLC is the public operating company that resulted from the business combination of AIR Limited with a special purpose acquisition company, which completed in May 2026, and is accordingly not a “blank check company” for purposes of these safe harbor provisions.
Any express or implied statements contained in this shareholder letter that are not statements of historical fact may be deemed forward-looking statements, including, without limitation, statements regarding future results of operations and financial position; FY2026 and FY2027 financial outlook and medium-term guidance; shipment volumes and growth; future costs, margins, working capital and leverage; the Greentank investment and related ownership option; PMTA filings and related costs, FDA acceptance and Crown Switch commercialization; New Growth Categories; returns on capital; the impact of excise tax changes; market, industry and competitor developments; share count and Earnout Shares; business strategy; capital allocation; and management’s plans and objectives. Forward-looking statements may include words such as “expect,” “intend,” “plan,” “believe,” “think,” “project,” “forecast,” “estimate,” “may,” “should,” “would,” “anticipate,” “will,” “likely,” “aim,” “potential,” “continue” and similar expressions.
Forward-looking statements are neither promises nor guarantees and involve known and unknown risks and uncertainties that could cause actual results to differ materially, including supply-chain and shipment disruption, and higher logistics and raw-material costs; dependence on distributors and suppliers; competition and cannibalization; FDA review and authorization of PMTA applications; regulatory change and enforcement; scientific-study outcomes; product development and commercialization; excise taxes and illicit trade; consumer preferences; the accuracy of market, industry and competitor estimates; foreign exchange; dilution; tariffs and trade policy; general economic conditions; realization of anticipated investment benefits; tax, legal and accounting developments; internal control over financial reporting; and the other factors discussed under “Risk Factors” in AIR’s Registration Statement on Form F-1, as amended, filed with the U.S. Securities and Exchange Commission (“SEC”), as such factors may be updated from time to time in AIR’s other filings with the SEC, including its Reports on Form 6-K. Any forward-looking statement speaks only as of the date made. AIR disclaims any obligation to update or revise forward-looking statements except as required by applicable law.
Use of Non-IFRS Financial Measures
This shareholder letter includes EBITDA and Adjusted EBITDA, each of which is not presented in accordance with IFRS and may differ from similarly titled measures used by other companies.
AIR defines EBITDA as earnings for the period before interest, taxation, depreciation and amortization. The most directly comparable IFRS measure is profit/(loss) for the period. EBITDA is an intermediate step in AIR’s calculation of Adjusted EBITDA.
AIR defines Adjusted EBITDA as earnings before interest, taxes, depreciation and amortization, further adjusted to exclude items such as non-recurring expenses, share-based compensation and other non-operating expenses. AIR believes Adjusted EBITDA assists investors and management in evaluating operating performance consistently, but it should not be considered in isolation or as a substitute for IFRS results.
Adjusted EBITDA does not reflect cash expenditures or capital requirements, working-capital needs, interest or principal payments, cash taxes, or the future replacement of depreciated and amortized assets. Other companies may calculate the measure differently, and management’s adjustments involve judgment. A reconciliation of profit/(loss) for the period to Adjusted EBITDA is provided in Appendix C to AIR’s Q3 2026 earnings release, furnished on Form 6-K on the date of this shareholder letter.
No Offer or Solicitation
This shareholder letter is for informational purposes only and does not constitute, and shall not be construed as, an offer to sell or the solicitation of an offer to buy any securities of AIR, nor shall there be any sale of securities in any state or jurisdiction in which such offer, solicitation or sale would be unlawful prior to registration or qualification under the securities laws of that state or jurisdiction.
Contacts
AIR Investor Relations:
Gaurav Jain: Gaurav.jain@air.global; +971-56-439-4296
Anuja Shendye: a.shendye@air.global; +971-58-907-8782
investor@air.global
AIR Media Relations:
ICR for AIR | AIRglobal@icrinc.com