
UNITED STATES
SECURITIES AND EXCHANGE COMMISSION
Washington, D.C. 20549
Form 6-K
REPORT OF FOREIGN PRIVATE ISSUER PURSUANT TO RULE 13a-16 OR 15d-16
UNDER THE SECURITIES EXCHANGE ACT OF 1934
For the month of September, 2026
Commission File Number: 001-43297
AIR Global PLC
(Translation of registrant’s name into English)
Festival Office Tower
Dubai Festival City, 7th Floor
Dubai
United Arab Emirates
(Address of principal executive office)
Indicate by check mark whether the registrant files or will file annual reports under cover of Form 20-F or Form 40-F.
Form 20-F ☒ Form 40-F ☐
INFORMATION CONTAINED IN THIS REPORT ON FORM 6-K
On September 8, 2026, AIR Global PLC (the “Company”) published an investor presentation, a copy of which is furnished hereto as Exhibit 99.1.
SIGNATURE
Pursuant to the requirements of the Securities Exchange Act of 1934, as amended, the registrant has duly caused this report to be signed on its behalf by the undersigned, thereunto duly authorized.
Date: September 8, 2026
| AIR Global PLC | ||
| By: | /s/ Stuart Brazier | |
| Name: Stuart Brazier | ||
| Title: Chief Executive Officer | ||
EXHIBIT INDEX
| Exhibit | Description | |
| 99.1 | Investor Presentation of AIR Global PLC, published September 8, 2026 | |
Exhibit 99.1

Day Month YearVersionFirst name Last name Investor Presentation Global Innovation Leader in Social Inhalation September 2026
Disclaimer 2 The following applies to the information following this page (this “Presentation”) by AIR Limited and/or its subsidiaries (“AIR”). By viewing all or part of this Presentation, you acknowledge and agree to be bound by the limitations and restrictions described herein. Any failure to comply with these restrictions may constitute a violation of applicable securities laws. This Presentation does not constitute (i) a solicitation of a proxy, consent or authorization with respect to any securities or in respect of the proposed Business Combination between AIR and Cantor Equity Partners III, Inc. (“CAEP”) or (ii) an offer to sell, a solicitation of an offer to buy, or a recommendation to purchase any security of CAEP, AIR, or any of their respective affiliates. You should not construe the contents of this Presentation as legal, tax, accounting or investment advice or a recommendation. You should consult your own counsel and tax and financial advisors as to legal and related matters concerning the matters described herein, and, by viewing this Presentation, you confirm that you are not relying upon the information contained herein to make any decision. This Presentation and information contained herein constitutes confidential information and is provided to you on the condition that you agree that you will hold it in strict confidence and not reproduce, disclose, forward or distribute it in whole or in part without the prior written consent of AIR and is intended for the recipient hereof only. This Presentation shall not constitute an offer to sell or the solicitation of an offer to buy securities of AIR, nor shall there be any sale of these securities in any state or jurisdiction in which such offer, solicitation or sale would be unlawful prior to registration or qualification under the securities laws of such state or jurisdiction. This Presentation does not constitute a “prospectus” within the meaning of the Securities Act of 1933, as amended. Any decision to purchase securities of AIR should be made solely on the basis of the information contained in a prospectus or other offering document to be issued by AIR in relation to a specific offering. No Representations and Warranties This Presentation is for informational purposes only. No representation or warranty, express or implied, is or will be given by AIR or any of its affiliates, directors, officers, employees or advisers or any other person as to the accuracy or completeness of the information in this Presentation, and no responsibility or liability whatsoever is accepted for the accuracy or sufficiency thereof or for any errors, omissions or misstatements, negligent or otherwise, relating thereto. The information contained in this Presentation is derived from various internal and external sources, is preliminary in nature and is subject to change, and any such changes may be material. Industry and Market Data In this Presentation, AIR relies on and refers to certain information and statistics based on AIR management’s estimates and/or obtained from third-party sources which it believes to be reliable. AIR has not independently verified the accuracy or completeness of any such third-party information. Forward-Looking Statements This Presentation includes “forward-looking statements” within the meaning of the “safe harbor” provisions of the United States Private Securities Litigation Reform Act of 1995. AIR’s actual results may differ from its expectations, estimates and projections and consequently, you should not rely on these forward-looking statements as predictions of future events. Words such as “expect”, “estimate”, “project”, “budget”, “forecast”, “anticipate”, “intend”, “plan”, “may”, “will”, “could”, “should”, “believes”, “predicts”, “potential”, “continue”, and similar expressions are intended to identify such forward-looking statements. These forward-looking statements include, without limitation, statements regarding AIR’s intentions, beliefs or current expectations concerning, among other things, product introduction, partnerships and collaborations, results of operations, financial condition, liquidity, prospects, growth and strategies. By their nature, forward-looking statements involve risks and uncertainties because they relate to events and depend on circumstances that may or may not occur in the future. These forward-looking statements involve significant risks and uncertainties that could cause the actual results to differ materially from the expected results. Most of these factors are outside the control of AIR and are difficult to predict. You should not place undue reliance upon any forward-looking statements, which speak only as of the date made. AIR undertakes or accepts no obligation to release publicly any updates or revisions to any forward-looking statements to reflect any change in its expectations or any change in events, conditions or circumstances on which any such statement is based. Trademarks This Presentation may contain trademarks, service marks, trade names and copyrights of other companies, which are the property of their respective owners and does not imply an affiliation with, or endorsement by, the owners of these trademarks, service marks, trade names and copyrights. Solely for convenience, some of the trademarks, service marks, trade names and copyrights referred to in this Presentation may be listed without the TM, SM © or © symbols, but AIR will assert, to the fullest extent under applicable law, the rights of the applicable owners, if any, to these trademarks, service marks, trade names and copyrights. Use of Non-IFRS Financial Measures This Presentation includes certain financial measures that are not prepared in accordance with the IFRS as promulgated by the International Standards Accounting Board and that may be different from non-IFRS financial measures used by other companies, such as Adjusted EBITDA, Adjusted EBITDA Margin and Net Operating Cash Conversion. These non-IFRS measures, and other measures that are calculated using these non-IFRS measures, are an addition, and not a substitute for or superior to measures of financial performance prepared in accordance with IFRS and should not be considered as an alternative to profit for the year, net cash generated from operating activities or any other performance measures derived in accordance with IFRS. AIR believes that these non-IFRS measures of financial results provide useful supplemental information to investors. However, there are a number of limitations related to the use of these non-IFRS measures and their nearest IFRS equivalents. For example, other companies may calculate non-IFRS measures differently or may use other measures to calculate their financial performance, and therefore AIR’s non-IFRS measures may not be directly comparable to similarly titled measures of other companies. Figures of non-IFRS measures presented in this Presentation are unaudited and unreviewed by AIR’s independent auditors and could be subject to change.
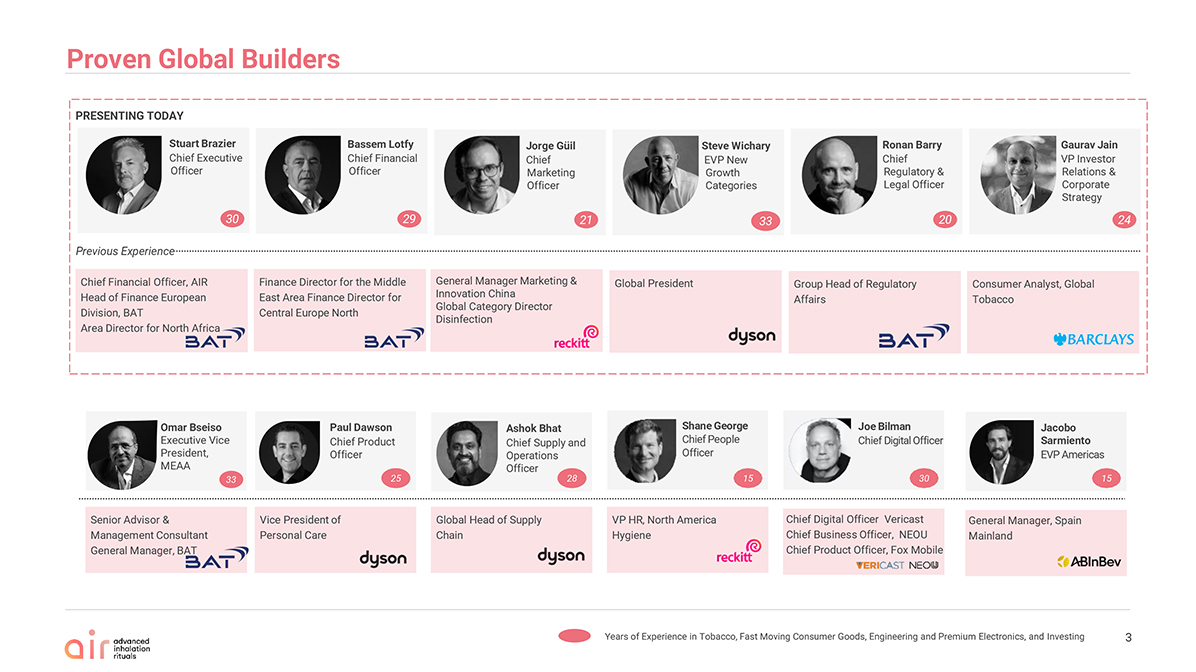
Chief Financial Officer, AIR Head of Finance European Division, BAT Area Director for North Africa Finance Director for the Middle East Area Finance Director for Central Europe North General Manager Marketing & Innovation China Global Category Director Disinfection Global President Group Head of Regulatory Affairs Consumer Analyst, Global Tobacco Jorge Güil Chief Marketing Officer Steve Wichary EVP New Growth Categories Ronan Barry Chief Regulatory & Legal Officer Gaurav Jain VP Investor Relations & Corporate Strategy Senior Advisor & Management Consultant General Manager, BAT Omar Bseiso Executive VicePresident, MEAA Jacobo Sarmiento EVP Americas 15 General Manager, Spain Mainland Proven GlobalBuilders Years of Experience in Tobacco, Fast Moving Consumer Goods, Engineering and Premium Electronics, and Investing PRESENTING TODAY 27 Global Head of Supply Chain Ashok Bhat Chief Supply and Operations Officer 28 Paul Dawson Chief Product Officer Vice President of Personal Care 25 JoeBilman ChiefDigitalOfficer 30 Chief Digital Officer Vericast Chief Business Officer, NEOU Chief Product Officer, Fox Mobile VP HR, North America Hygiene ShaneGeorge ChiefPeople Officer 15 Stuart Brazier Chief Executive Officer Previous Experience 30 Bassem Lotfy Chief Financial Officer 29 21 33 33 20 24 3
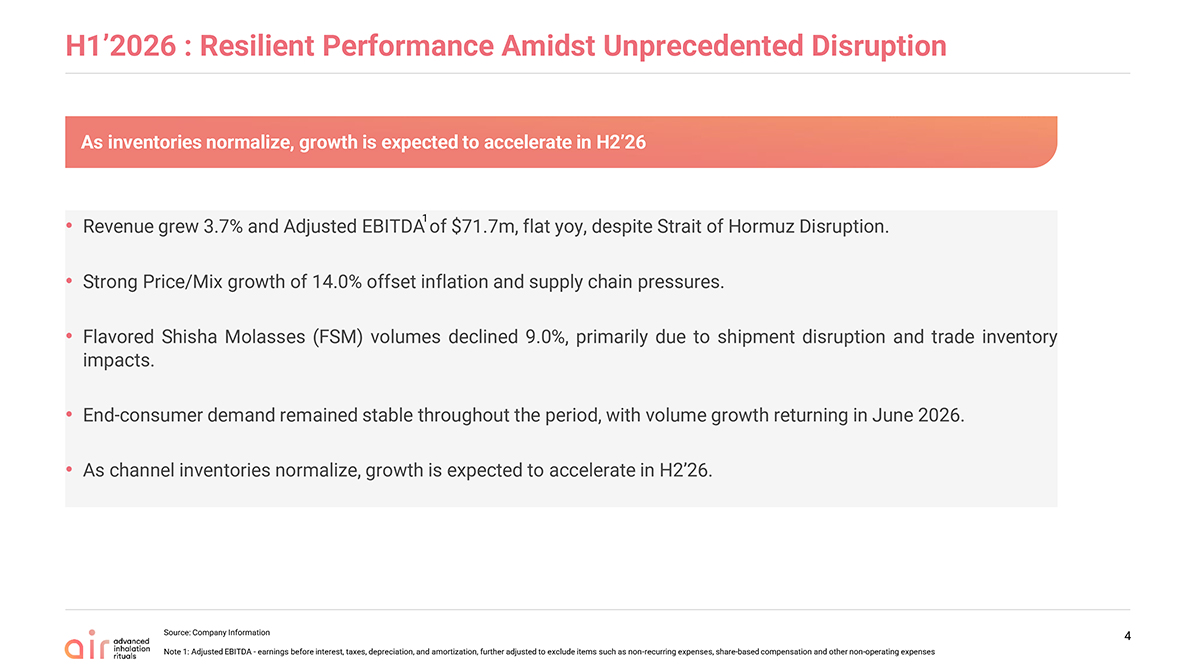
H1’2026 : Resilient Performance Amidst Unprecedented Disruption Revenue grew 3.7% and Adjusted EBITDA of $71.7m, flat yoy, despite Strait of Hormuz Disruption. Strong Price/Mix growth of 14.0% offset inflation and supply chain pressures. Flavored Shisha Molasses (FSM) volumes declined 9.0%, primarily due to shipment disruption and trade inventory impacts. End-consumer demand remained stable throughout the period, with volume growth returning in June 2026. As channel inventories normalize, growth is expected to accelerate in H2’26. Source: Company Information Note 1: Adjusted EBITDA—earnings before interest, taxes, depreciation, and amortization, further adjusted to exclude items such as non-recurring expenses, share-based compensation and other non-operating expenses 4
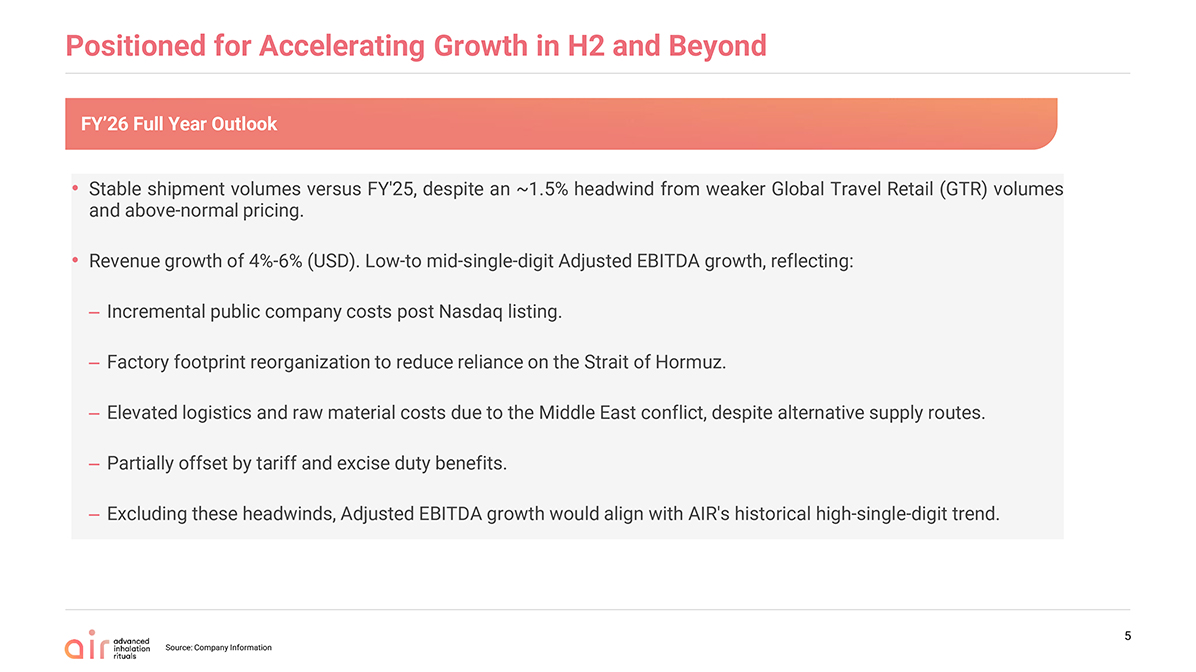
Positioned for Accelerating Growth in H2 and Beyond Stable shipment volumes versus FY’25, despite an ~1.5% headwind from weaker Global Travel Retail (GTR) volumes and above-normal pricing. Revenue growth of 4%-6% (USD). Low-to mid-single-digit Adjusted EBITDA growth, reflecting:Incremental public company costs post Nasdaq listing. Factory footprint reorganization to reduce reliance on the Strait of Hormuz. Elevated logistics and raw material costs due to the Middle East conflict, despite alternative supply routes. Partially offset by tariff and excise duty benefits. Excluding these headwinds, Adjusted EBITDA growth would align with AIR’s historical high-single-digit trend. 5 Source: Company Information FY’26 Full Year Outlook
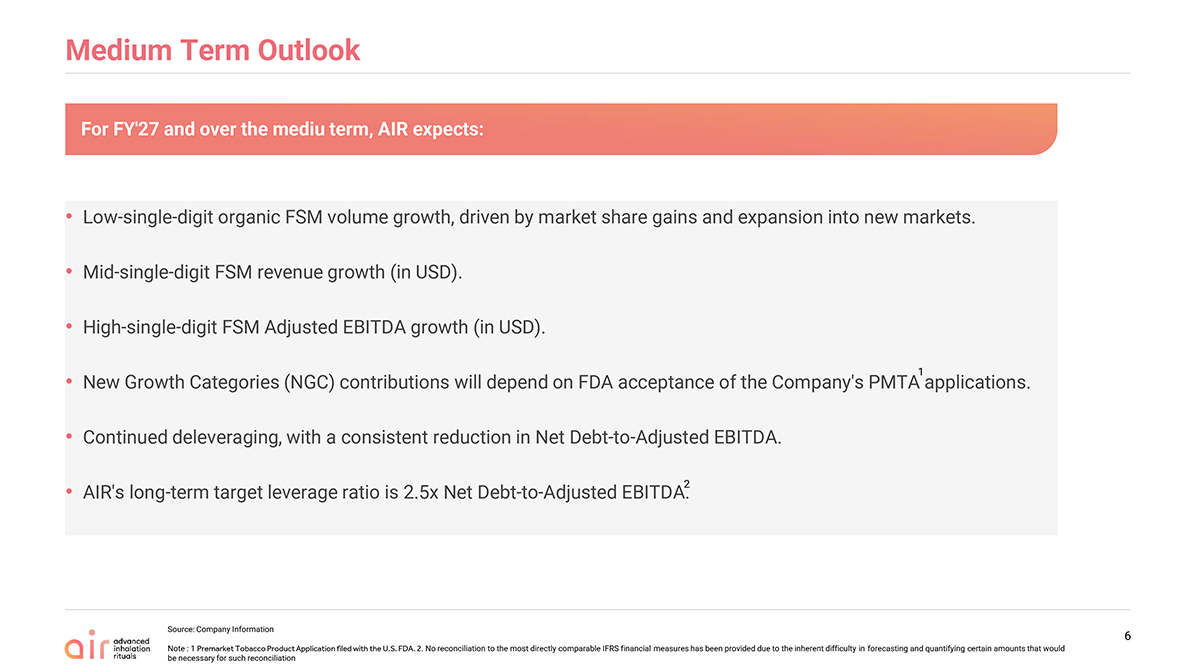
Medium Term Outlook Low-single-digit organic FSM volume growth, driven by market share gains and expansion into new markets. Mid-single-digit FSM revenue growth (in USD). High-single-digit FSM Adjusted EBITDA growth (in USD). New Growth Categories (NGC) contributions will depend on FDA acceptance of the Company’s PMTA applications. Continued deleveraging, with a consistent reduction in Net Debt-to-Adjusted EBITDA. AIR’s long-term target leverage ratio is 2.5x Net Debt-to-Adjusted EBITDA. 6 Source: Company Information Note : 1 Premarket Tobacco Product Application filed with the U.S. FDA. 2. No reconciliation to the most directly comparable IFRS financial measures has been provided due to the inherent difficulty in forecasting and quantifying certain amounts that would be necessary for such reconciliation 2 1 For FY’27 and over the mediu term, AIR expects:
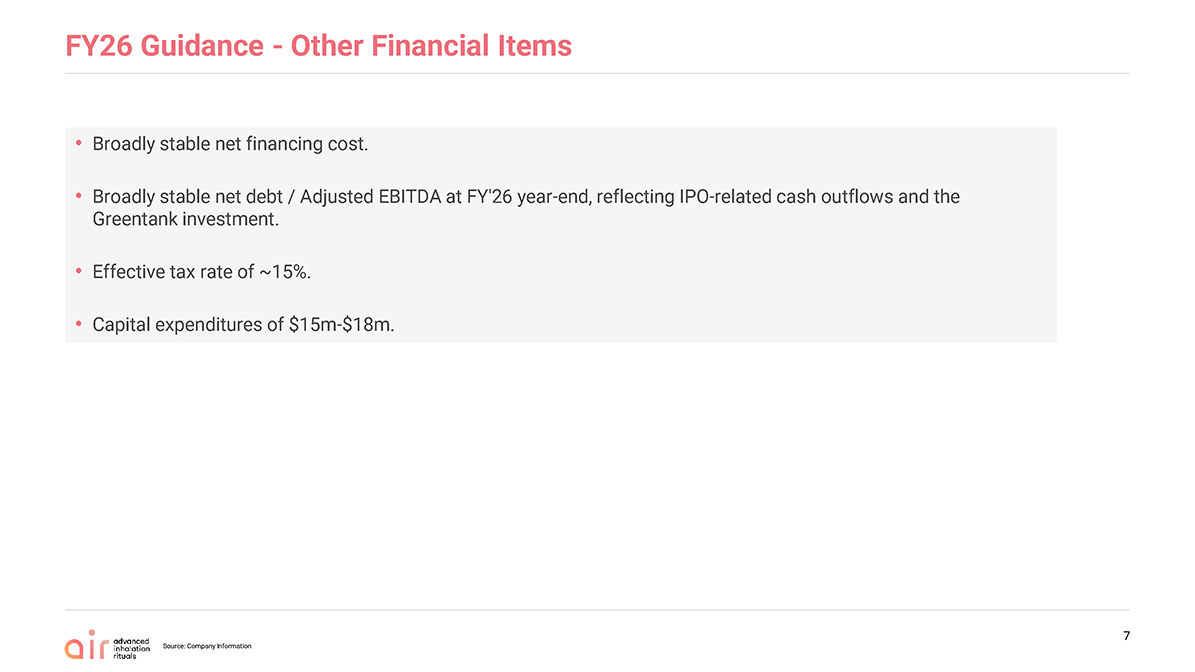
FY26 Guidance - Other Financial Items • Broadly stable net financing cost.• Broadly stable net debt / Adjusted EBITDA at FY’26 year-end, reflecting IPO-related cash outflows and theGreentank investment.• Effective tax rate of ~15%.• Capital expenditures of $15m-$18m.
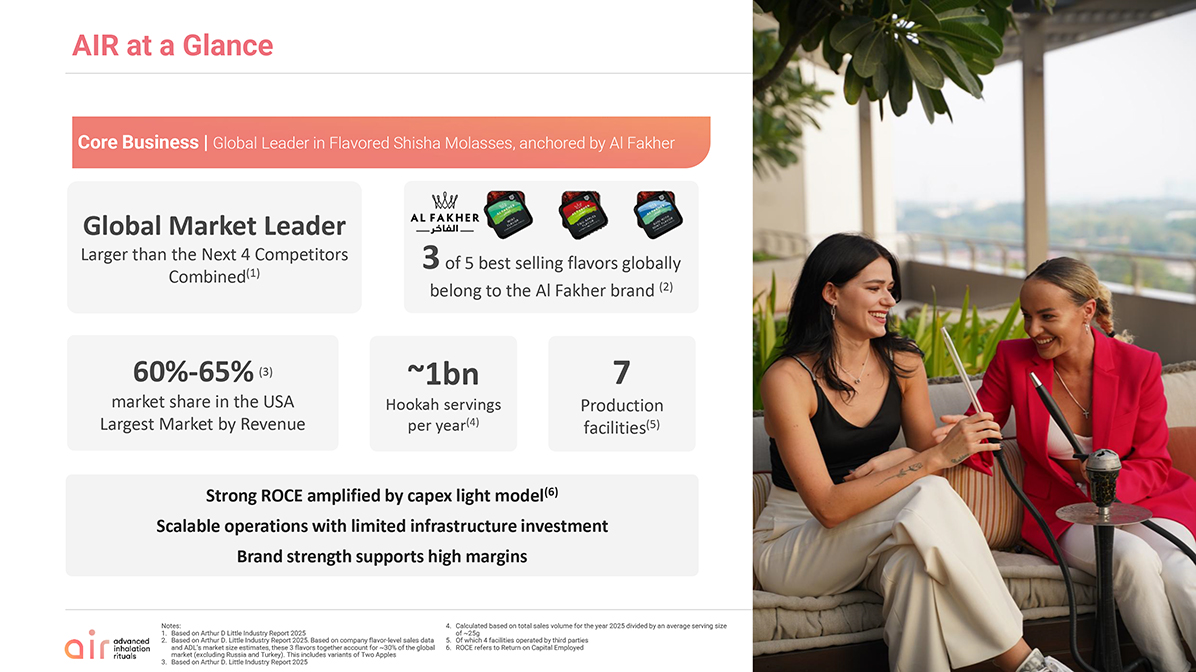
AIR at a Glance Strong ROCE amplified by capex light model(6) Scalable operations with limited infrastructure investment Brand strength supports high margins ~1bn Hookah servings per year(4) 7 Production facilities(5) 60%-65% (3) market share in the USA Largest Market by Revenue 3 of 5 best selling flavors globally belong to the Al Fakher brand (2) Global Market Leader Larger than the Next 4 Competitors Combined(1) 6 Notes: Based on Arthur D Little Industry Report 2025 Based on Arthur D. Little Industry Report 2025. Based on company flavor-level sales data and ADL’s market size estimates, these 3 flavors together account for ~30% of the global market (excluding Russia and Turkey). This includes variants of Two Apples Based on Arthur D. Little Industry Report 2025 Calculated based on total sales volume for the year 2025 divided by an average serving size of ~25g Of which 4 facilities operated by third parties ROCE refers to Return on Capital Employed Core Business | Global Leader in Flavored Shisha Molasses, anchored by Al Fakher
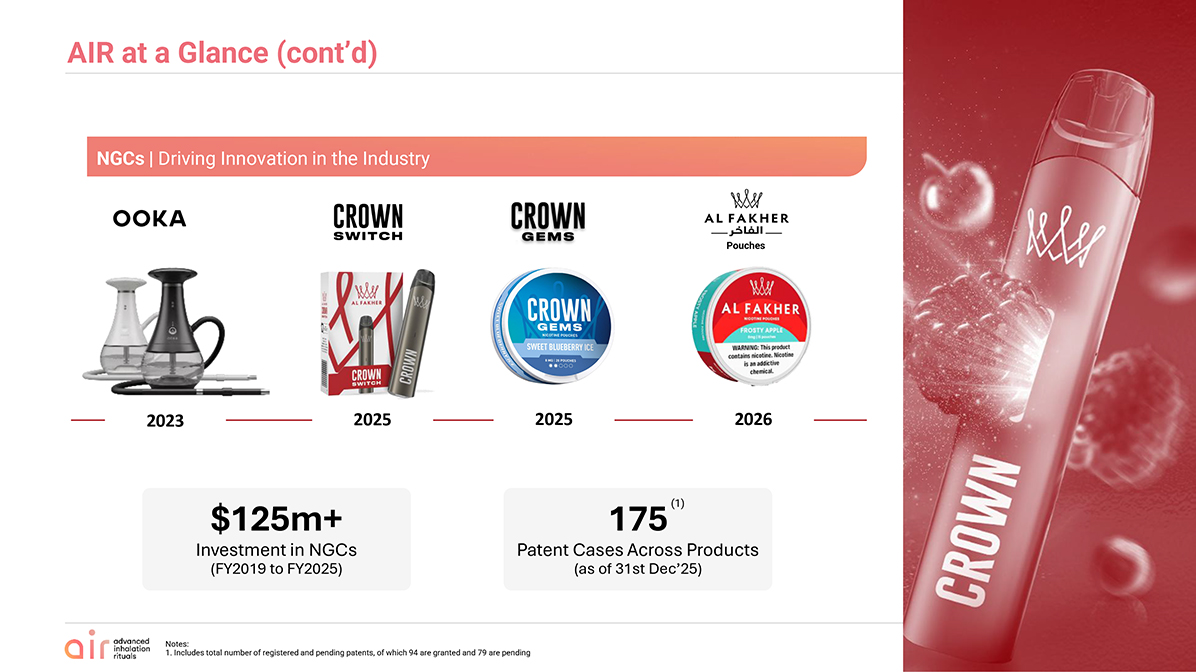
AIR at a Glance (cont’d) Notes: 1. Includes total number of registered and pending patents, of which 94 are granted and 79 are pending 6 NGCs | Driving Innovation in the Industry 2023 2025 2025 2026 Pouches $125m+ Investment in NGCs (FY2019 to FY2025) 175 Patent Cases Across Products (as of 31st Dec’25) (1)
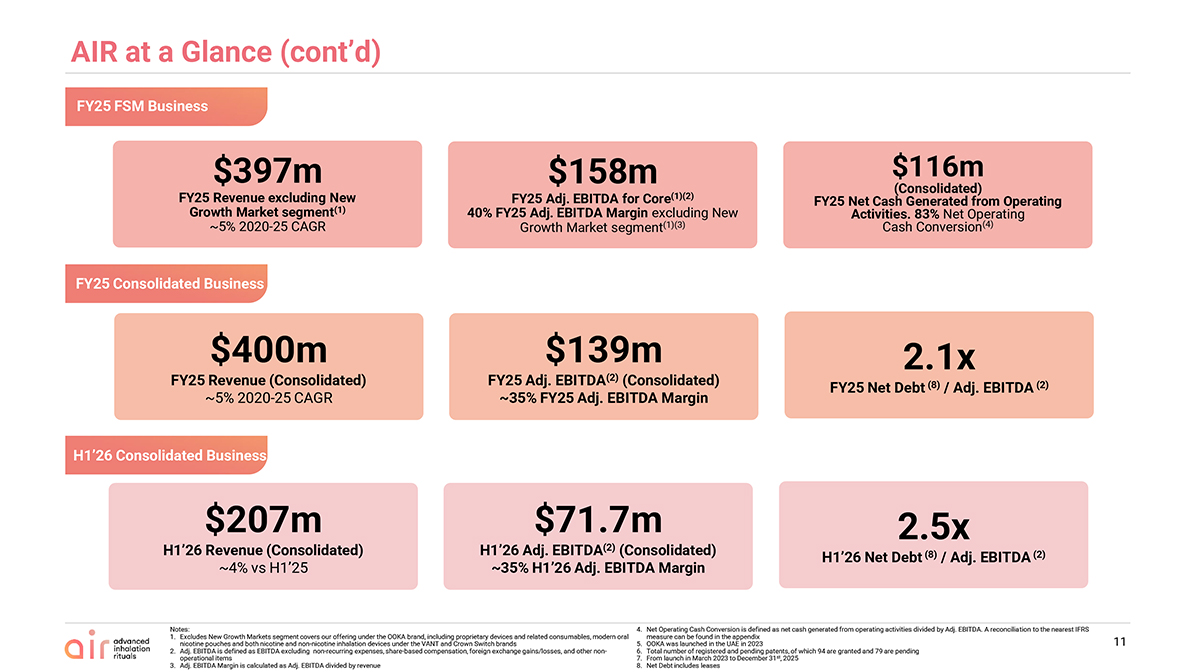
Notes: Excludes New Growth Markets segment covers our offering under the OOKA brand, including proprietary devices and related consumables, modern oral nicotine pouches and both nicotine and non-nicotine inhalation devices under the VANT and Crown Switch brands Adj. EBITDA is defined as EBITDA excluding non-recurring expenses, share-based compensation, foreign exchange gains/losses, and other non-operational items Adj. EBITDA Margin is calculated as Adj. EBITDA divided by revenue Net Operating Cash Conversion is defined as net cash generated from operating activities divided by Adj. EBITDA. A reconciliation to the nearest IFRS measure can be found in the appendix OOKA was launched in the UAE in 2023 Total number of registered and pending patents, of which 94 are granted and 79 are pending From launch in March 2023 to December 31st, 2025 Net Debt includes leases AIR at a Glance (cont’d) $400m FY25 Revenue (Consolidated) ~5% 2020-25 CAGR $139m FY25 Adj. EBITDA(2) (Consolidated) ~35% FY25 Adj. EBITDA Margin $116m(Consolidated) FY25 Net Cash Generated from Operating Activities. 83% Net Operating Cash Conversion(4) $397m FY25 Revenue excluding New Growth Market segment(1) ~5% 2020-25 CAGR $158m FY25 Adj. EBITDA for Core(1)(2) 40% FY25 Adj. EBITDA Margin excluding New Growth Market segment(1)(3) 2.1x FY25 Net Debt (8) / Adj. EBITDA (2) $207m H1’26 Revenue (Consolidated) ~4% vs H1’25 $71.7m H1’26 Adj. EBITDA(2) (Consolidated) ~35% H1’26 Adj. EBITDA Margin 2.5x H1’26 Net Debt (8) / Adj. EBITDA (2) FY25 FSM Business FY25 Consolidated Business H1’26 Consolidated Business 11

Flavoured Shisha Molasses (FSM) Overview
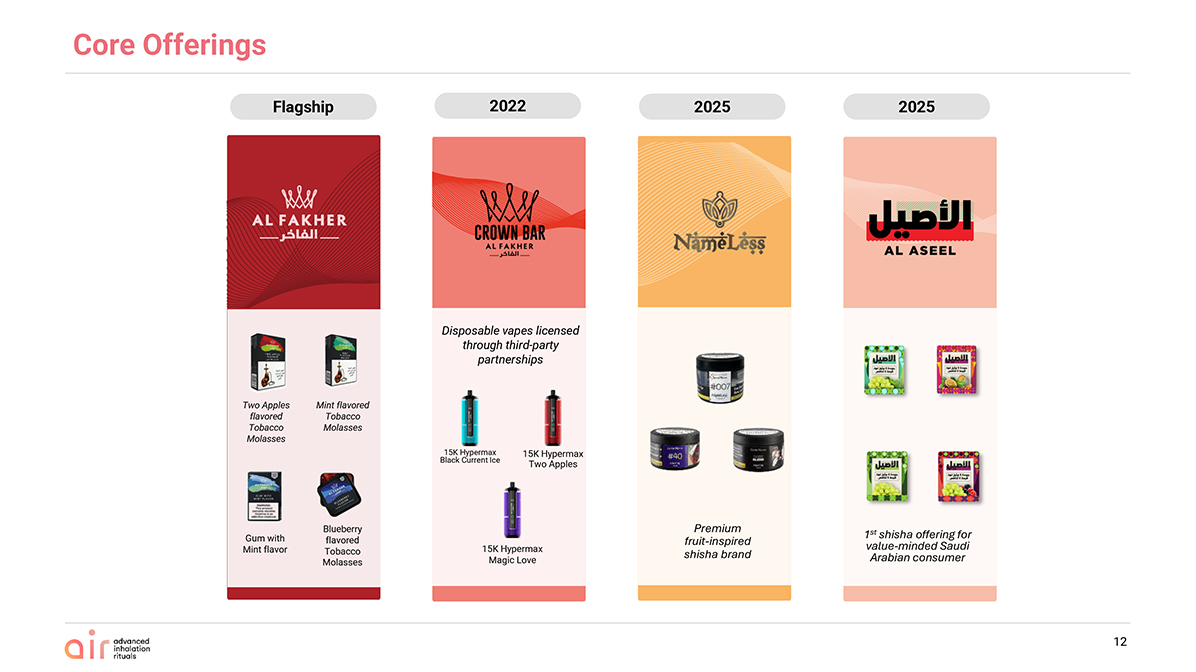
Two Apples flavored Tobacco Molasses Mint flavored Tobacco Molasses Gum with Mint flavor Blueberry flavored Tobacco Molasses Flagship Disposable vapes licensed through third-party partnerships 2022 2025 2025 Core Offerings 15K Hypermax Black Current Ice 15K Hypermax Two Apples 15K Hypermax Magic Love Premium fruit-inspired shisha brand 1st shisha offering for value-minded Saudi Arabian consumer 12
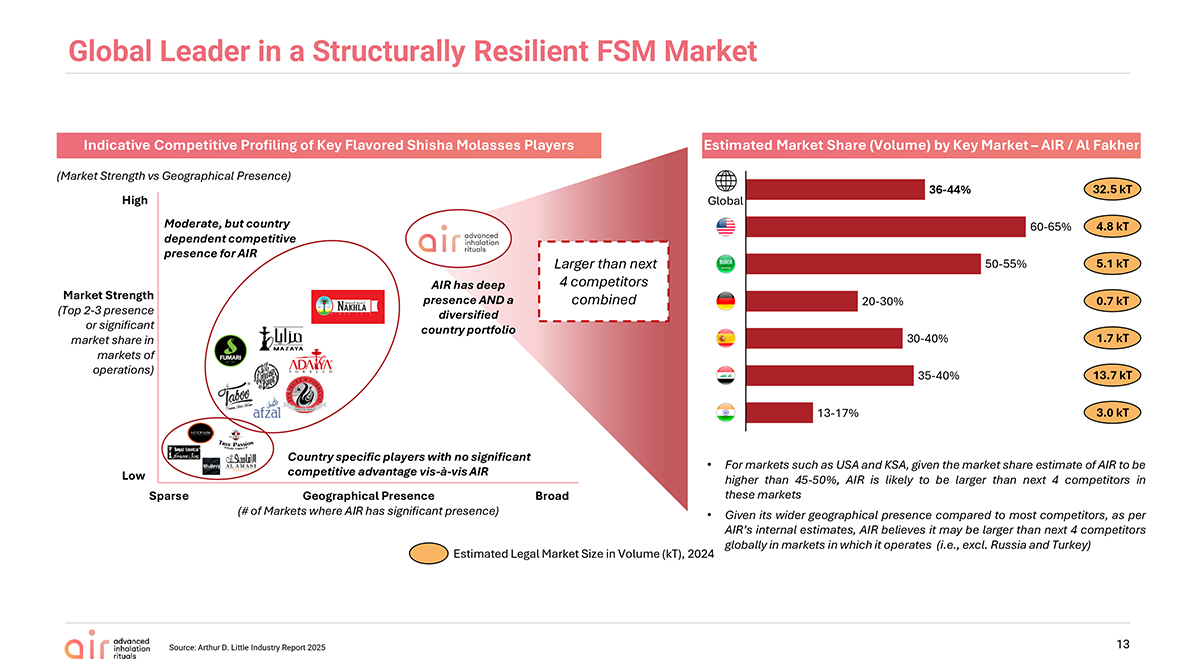
13 Indicative Competitive Profiling of Key Flavored Shisha Molasses Players Estimated Market Share (Volume) by Key Market – AIR / Al Fakher Source: Arthur D. Little Industry Report 2025 (Market Strength vs Geographical Presence) Moderate, but country dependent competitive presence for AIR AIR has deep presence AND a diversified country portfolio Country specific players with no significant competitive advantage vis-à-vis AIR Market Strength (Top 2-3 presence or significant market share in markets of operations) High Low Sparse Broad Geographical Presence (# of Markets where AIR has significant presence) For markets such as USA and KSA, given the market share estimate of AIR to be higher than 45-50%, AIR is likely to be larger than next 4 competitors in these markets Given its wider geographical presence compared to most competitors, as per AIR’s internal estimates, AIR believes it may be larger than next 4 competitors globally in markets in which it operates (i.e., excl. Russia and Turkey) Estimated Legal Market Size in Volume (kT), 2024 4.8 kT 5.1 kT 0.7 kT 1.7 kT 13.7 kT 3.0 kT Larger than next 4 competitors combined Global 36-44% 60-65% 50-55% 20-30% 30-40% 35-40% 13-17% 32.5 kT Global Leader in a Structurally Resilient FSM Market
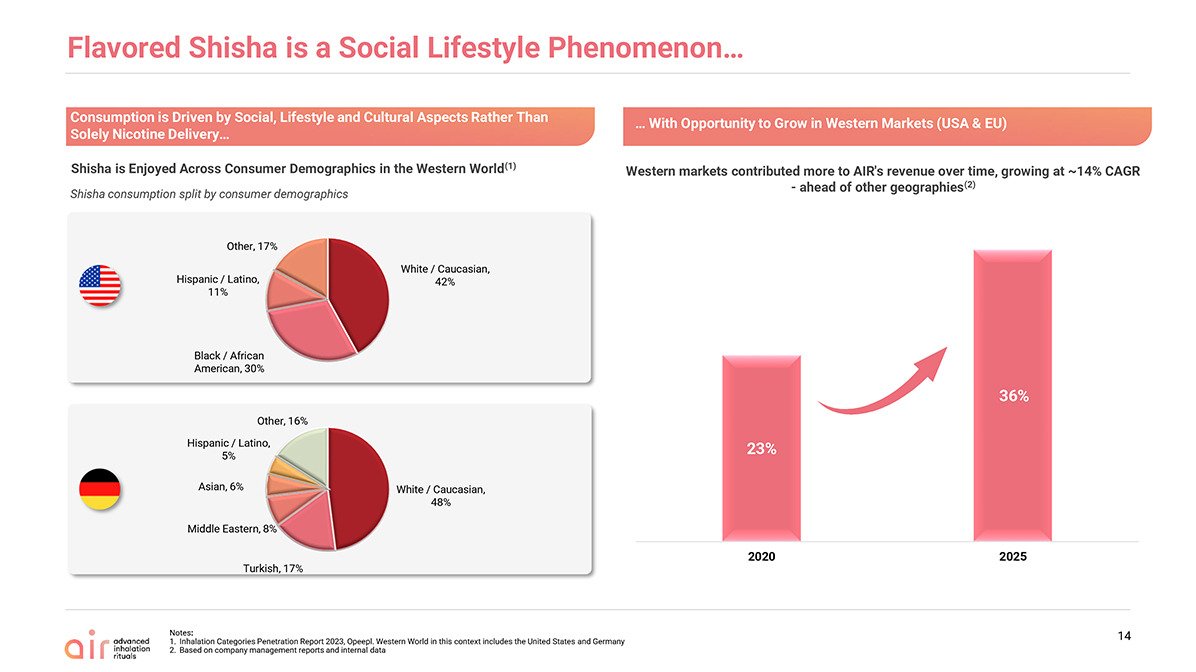
Flavored Shisha is a Social Lifestyle Phenomenon… 14 Consumption is Driven by Social, Lifestyle and Cultural Aspects Rather Than Solely Nicotine Delivery… Shisha is Enjoyed Across Consumer Demographics in the Western World(1) Shisha consumption split by consumer demographics Notes: Inhalation Categories Penetration Report 2023, Opeepl. Western World in this context includes the United States and Germany Based on company management reports and internal data Western markets contributed more to AIR’s revenue over time, growing at ~14% CAGR—ahead of other geographies(2) … With Opportunity to Grow in Western Markets (USA & EU) White / Caucasian, 42% Black / African American, 30% Hispanic / Latino, 11%Other, 17% White / Caucasian, 48% Turkish, 17% Middle Eastern, 8% Asian, 6% Hispanic / Latino, 5% Other, 16% 23% 36% 2020 2025
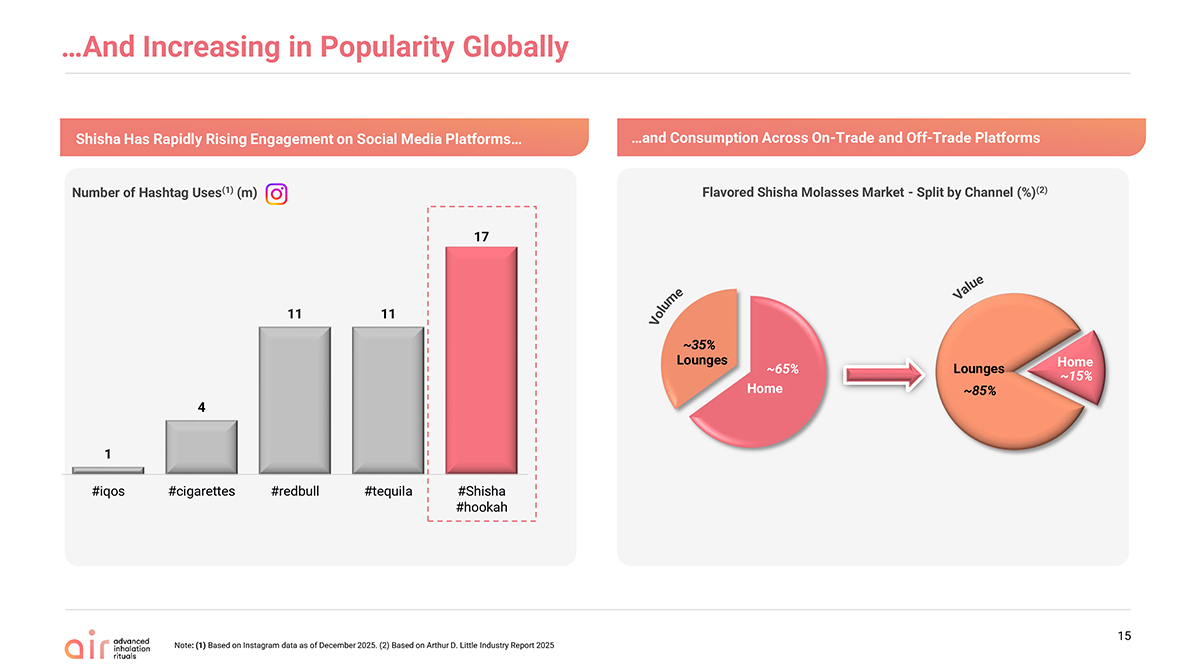
17 11 11 4 1 #Shisha #hookah #tequila #redbull #cigarettes #iqos …And Increasing in Popularity Globally Number of Hashtag Uses(1) (m) Note: (1) Based on Instagram data as of December 2025. (2) Based on Arthur D. Little Industry Report 2025 15 Shisha Has Rapidly Rising Engagement on Social Media Platforms… …and Consumption Across On-Trade and Off-Trade Platforms Volume Value Home Lounges Lounges Home Flavored Shisha Molasses Market—Split by Channel (%)(2)~65% ~35% ~85% ~1
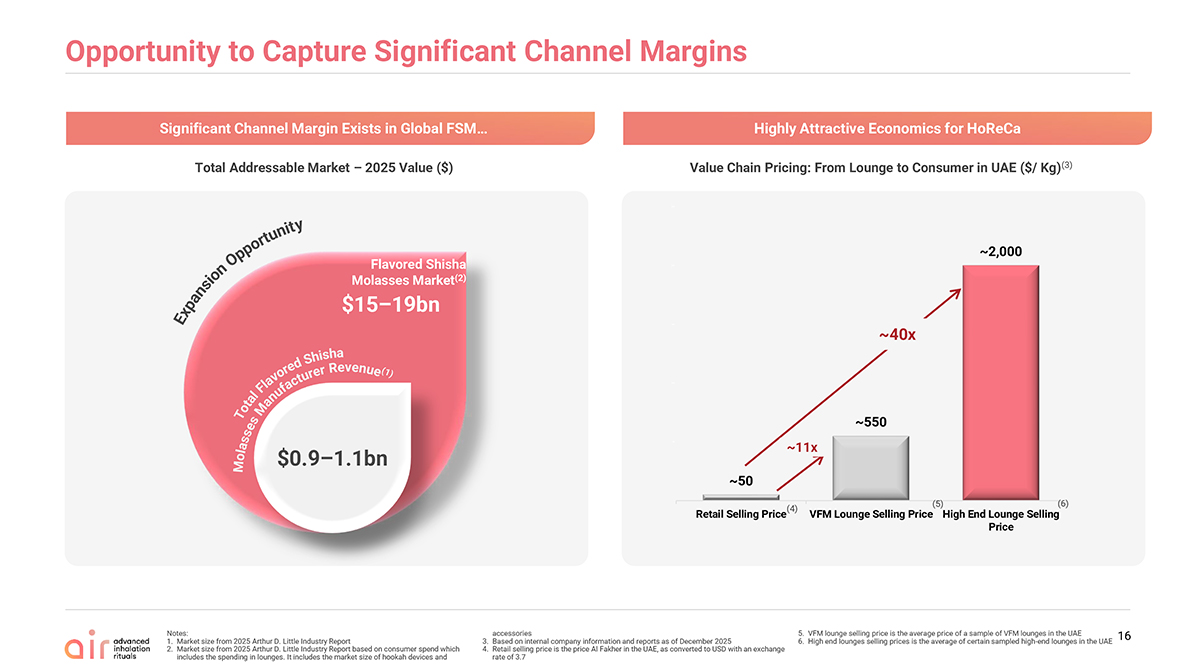
Opportunity to Capture Significant Channel Margins Total Addressable Market – 2025 Value ($) Value Chain Pricing: From Lounge to Consumer in UAE ($/ Kg)(3) ~11x ~40x (4) (5) (6) $0.9–1.1bn $15–19bn Flavored Shisha Molasses Market(2) ExpansionOpportunity TotalFlavoredShishaMolassesManufacturerRevenue(1) Notes: Market size from 2025 Arthur D. Little Industry Report Market size from 2025 Arthur D. Little Industry Report based on consumer spend which includes the spending in lounges. It includes the market size of hookah devices and accessories Based on internal company information and reports as of December 2025 Retail selling price is the price Al Fakher in the UAE, as converted to USD with an exchange rate of3.7 VFM lounge selling price is the average price of a sample of VFM lounges in the UAE High end lounges selling prices is the average of certain sampled high-end lounges in the UAE Significant Channel Margin Exists in Global FSM… Highly Attractive Economics for HoReCa 16~50 ~550 ~2,000—500 1,000 1,500 2,000 2,500 Retail Selling Price VFM Lounge Selling Price High End Lounge Selling Price
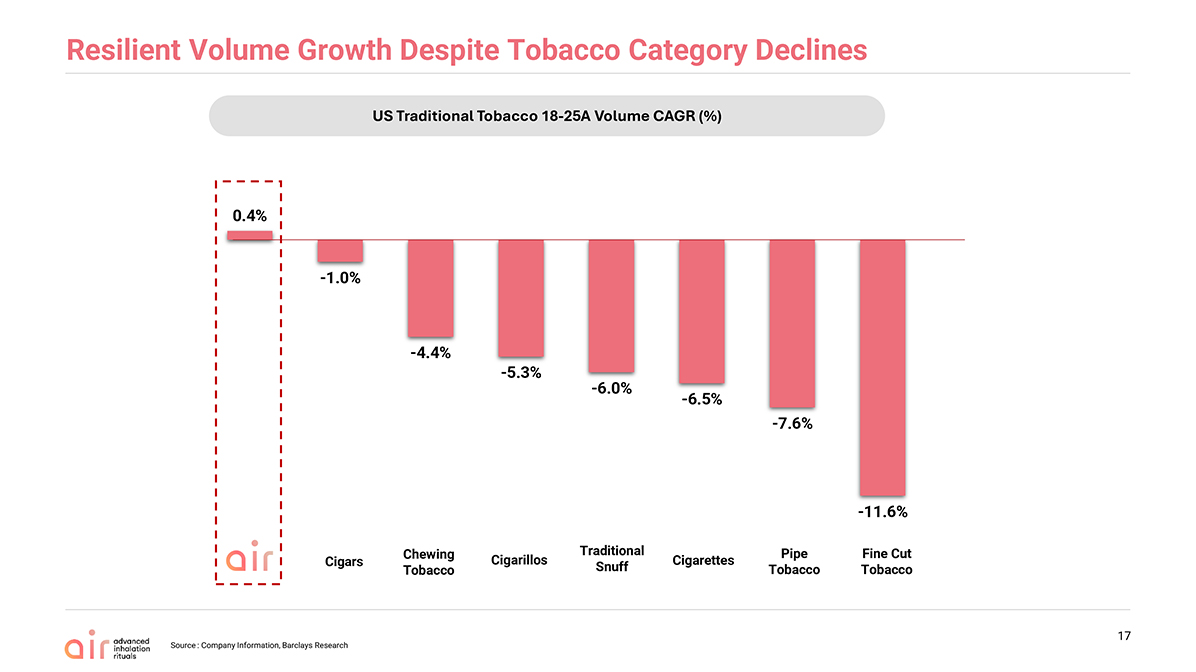
Resilient Volume Growth Despite Tobacco Category Declines Source : Company Information, Barclays Research 17 Fine Cut Tobacco Traditional Snuff Cigarettes Pipe Tobacco Cigarillos Cigars Chewing Tobacco US Traditional Tobacco 18-25A Volume CAGR (%)0.4% -1.0% -4.4% -5.3% -6.0% -6.5% -7.6% -11.6%
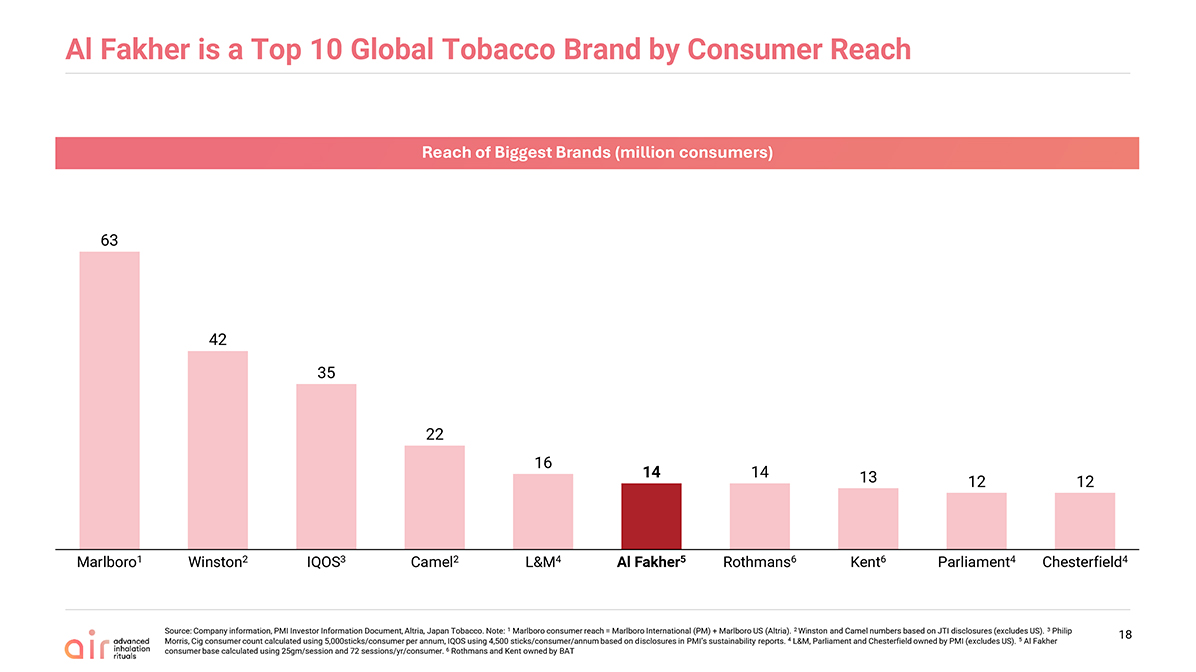
Al Fakher is a Top 10 Global Tobacco Brand by Consumer Reach Source: Company information, PMI Investor Information Document, Altria, Japan Tobacco. Note: 1 Marlboro consumer reach = Marlboro International (PM) + Marlboro US (Altria). 2 Winston and Camel numbers based on JTI disclosures (excludes US). 3 Philip Morris, Cig consumer count calculated using 5,000sticks/consumer per annum, IQOS using 4,500 sticks/consumer/annum based on disclosures in PMI’s sustainability reports. 4 L&M, Parliament and Chesterfield owned by PMI (excludes US). 5 Al Fakher consumer base calculated using 25gm/session and 72 sessions/yr/consumer. 6 Rothmans and Kent owned by BAT Reach of Biggest Brands (million consumers) Marlboro1 Winston2 IQOS3 Camel2 L&M4 Al Fakher5 Rothmans6 Kent6 Parliament4 Chesterfield4 1863 42 35 22 16 14 14 13 12 12
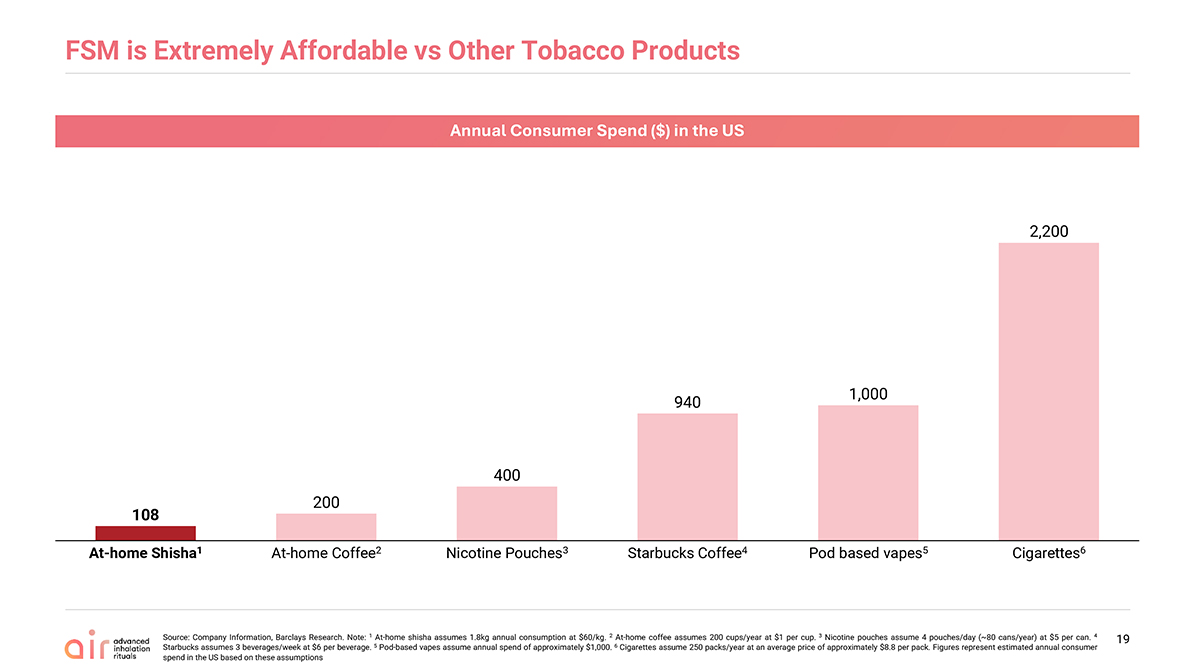
FSM is Extremely Affordable vs Other Tobacco Products Source: Company Information, Barclays Research. Note: 1 At-home shisha assumes 1.8kg annual consumption at $60/kg. 2 At-home coffee assumes 200 cups/year at $1 per cup. 3 Nicotine pouches assume 4 pouches/day (~80 cans/year) at $5 per can. 4 Starbucks assumes 3 beverages/week at $6 per beverage. 5 Pod-based vapes assume annual spend of approximately $1,000. 6 Cigarettes assume 250 packs/year at an average price of approximately $8.8 per pack. Figures represent estimated annual consumer spend in the US based on these assumptions Annual Consumer Spend ($) in the US At-home Shisha1 At-home Coffee2 Nicotine Pouches3 Starbucks Coffee4 Pod based vapes5 Cigarettes6 19108 200 400 940 1,000 2,200
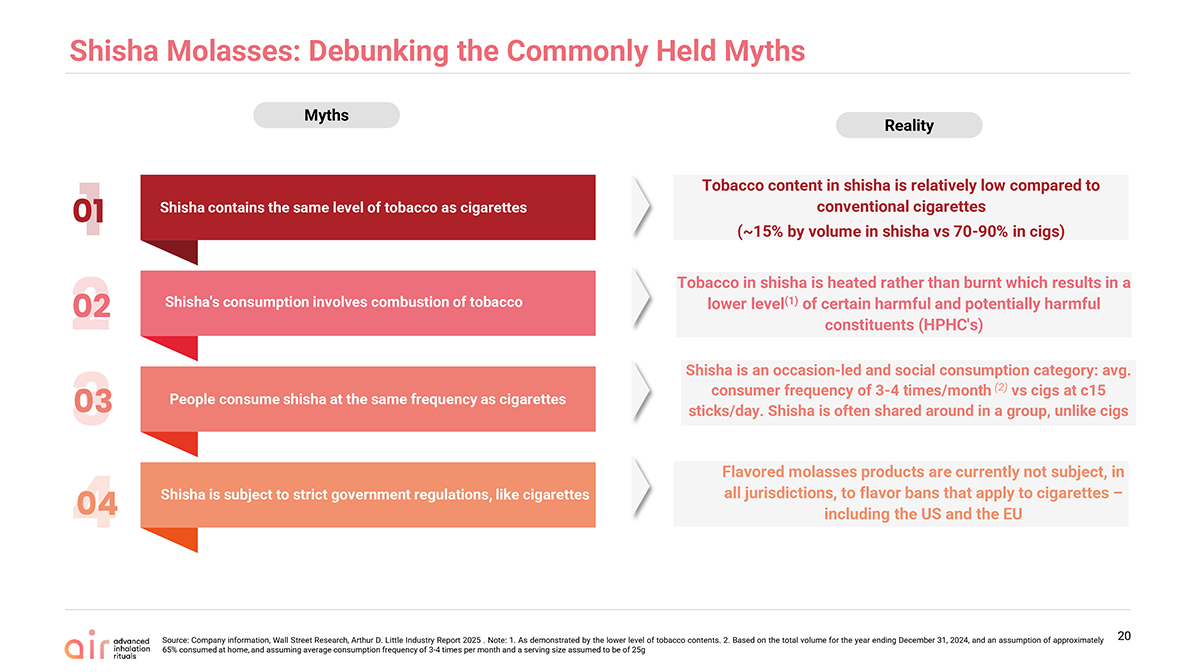
Shisha Molasses: Debunking the Commonly Held Myths Source: Company information, Wall Street Research, Arthur D. Little Industry Report 2025 . Note: 1. As demonstrated by the lower level of tobacco contents. 2. Based on the total volume for the year ending December 31, 2024, and an assumption of approximately 65% consumed at home, and assuming average consumption frequency of 3-4 times per month and a serving size assumed to be of 25g 20 Shisha contains the same level of tobacco as cigarettes Shisha is subject to strict government regulations, like cigarettes People consume shisha at the same frequency as cigarettes Shisha’s consumption involves combustion of tobacco 01 02 03 04 Tobacco content in shisha is relatively low compared to conventional cigarettes (~15% by volume in shisha vs 70-90% in cigs) Tobacco in shisha is heated rather than burnt which results in a lower level(1) of certain harmful and potentially harmful constituents (HPHC’s) Shishais an occasion-led and social consumption category: avg. consumer frequency of 3-4 times/month (2) vs cigs at c15 sticks/day. Shisha is often shared around in a group, unlike cigs Flavored molasses products are currently not subject, in all jurisdictions, to flavor bans that apply to cigarettes – including the US and the EU Myths Reality
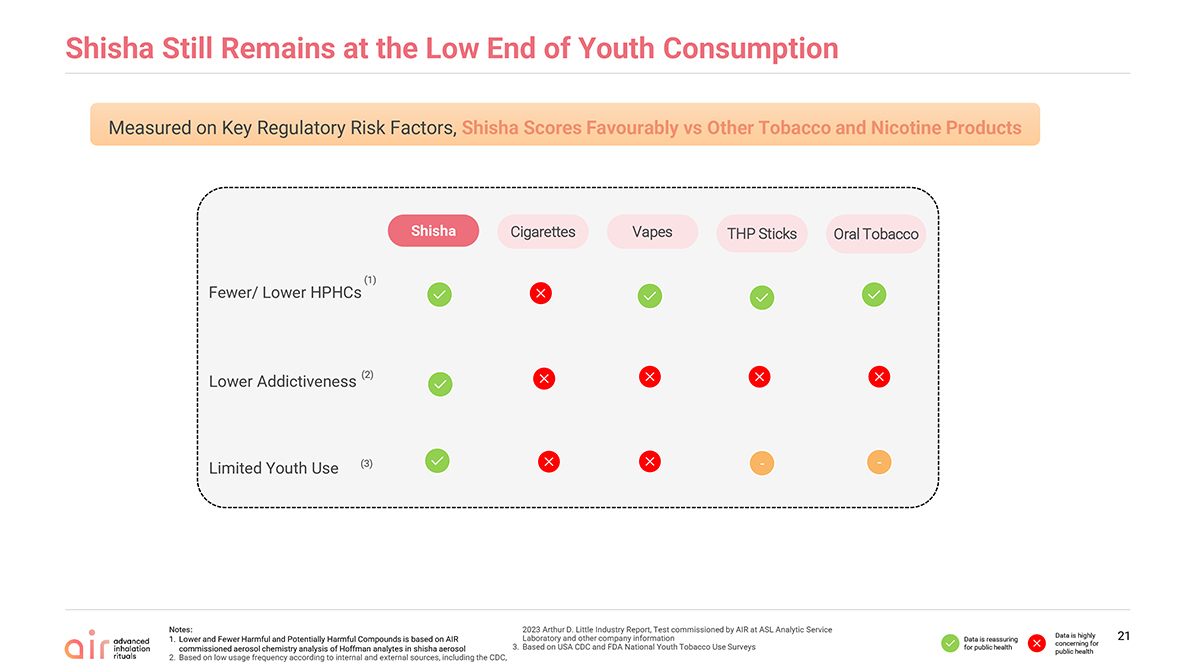
21 Shisha Still Remains at the Low End of Youth Consumption Measured on Key Regulatory Risk Factors, Shisha Scores Favourably vs Other Tobacco and Nicotine Products Cigarettes Vapes Oral Tobacco THP Sticks Shisha (2) Lower Addictiveness Fewer/ Lower HPHCs (1) (3) Limited Youth Use —— Notes: Lower and Fewer Harmful and Potentially Harmful Compounds is based on AIR commissioned aerosol chemistry analysis of Hoffman analytes in shisha aerosol Based on low usage frequency according to internal and external sources, including the CDC, 2023 Arthur D. Little Industry Report, Test commissioned by AIR at ASL Analytic Service Laboratory and other company information Based on USA CDC and FDA National Youth Tobacco Use Surveys Data is reassuring for public health Data is highly concerning for public health
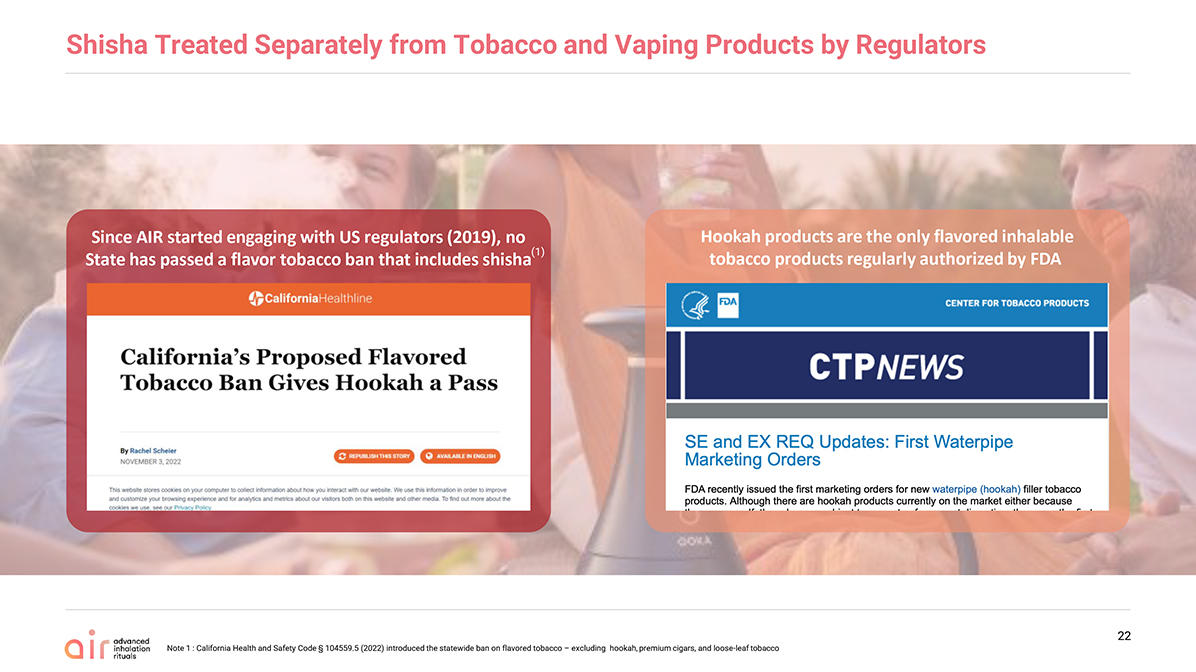
Shisha Treated Separately from Tobacco and Vaping Products by Regulators Since AIR started engaging with US regulators (2019), no State has passed a flavor tobacco ban that includes shisha Hookah products are the only flavored inhalable tobacco products regularlyauthorized by FDA 22 (1) Note 1 : California Health and Safety Code § 104559.5 (2022) introduced the statewide ban on flavored tobacco – excluding hookah, premium cigars, and loose-leaf tobacco
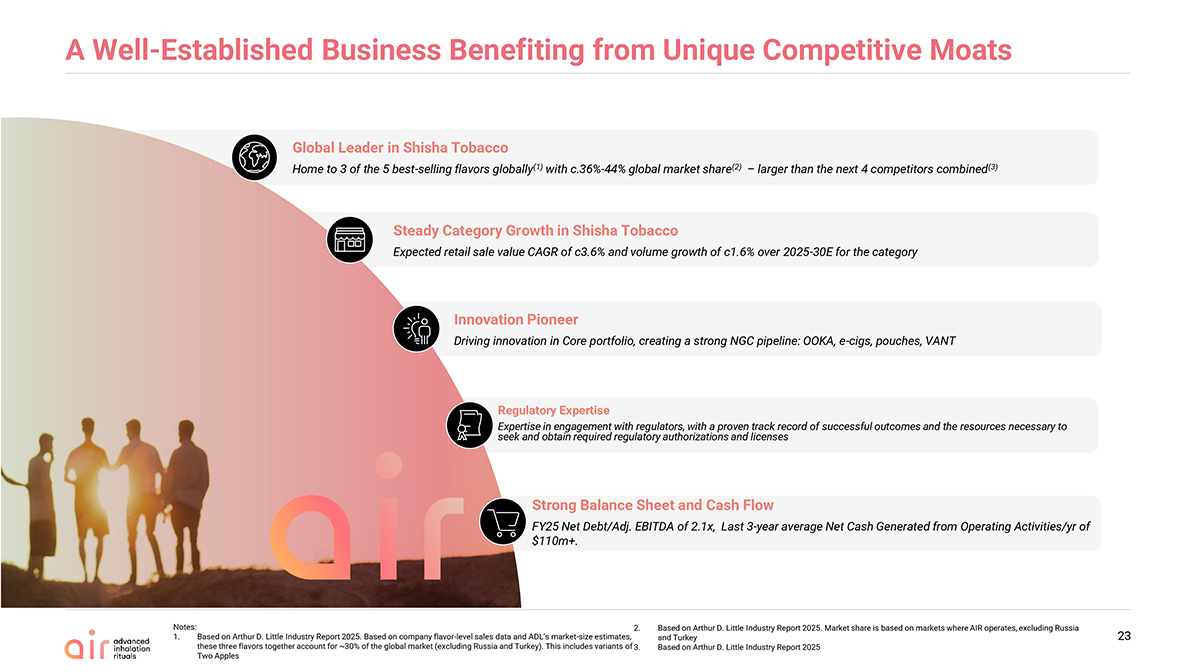
A Well-Established Business Benefiting from Unique Competitive Moats 23 Steady Category Growth in Shisha Tobacco Expected retail sale value CAGR of c3.6% and volume growth of c1.6% over 2025-30E for the category Strong Balance Sheet and Cash Flow FY25 Net Debt/Adj. EBITDA of 2.1x, Last 3-year average Net Cash Generated from Operating Activities/yr of $110m+. Global Leader in Shisha Tobacco Home to 3 of the 5 best-selling flavors globally(1) with c.36%-44% global market share(2) – larger than the next 4 competitors combined(3) Regulatory Expertise Expertise in engagement with regulators, with a proven track record of successful outcomes and the resources necessary to seek and obtain required regulatory authorizations and licenses The pure play heat not burn leader Innovation Pioneer Driving innovation in Core portfolio, creating a strong NGC pipeline: OOKA, e-cigs, pouches, VANT Notes: Based on Arthur D. Little Industry Report 2025. Based on company flavor-level sales data and ADL’s market-size estimates, these three flavors together account for ~30% of the global market (excluding Russia and Turkey). This includes variants of Two Apples Based on Arthur D. Little Industry Report 2025. Market share is based on markets where AIR operates, excluding Russia and Turkey Based on Arthur D. Little Industry Report 2025

Headline: Enter your headline here Sub-Header: Enter your optional sub-heading here Enter your text here Line 2 Line 3 Line 4 24 It all starts with Al Fakher The largest flavored molasses brand globally(1) Al Fakher owns 3 of the 5 Best-Selling Flavors Globally: Two Apples, Mint and Gum With Mint(2) ~14 million home consumers worldwide(3) Over 2.5 Million Al Fakher sessions enjoyed every day around the world(4) Notes: By sales volume according to the Arthur D. Little Industry Report 2025 According to the 2025 Arthur D. Little Industry Report. Based on company flavor-level sales data and ADL’s market-size estimates, these three flavors together account for ~30% of the global market (excluding Russia and Turkey). This includes variants of Two Apples According to the 2025 Arthur D. Little Industry Report. Based on AIR’s 2024 annual total volume, approximately 65% is consumed regularly by home users, typically 3–4 times per month, with an average serving size of 25 Daily sessions are estimated by dividing the annual total of ~1 billion sessions by 365 days (average serving size is ~25g)
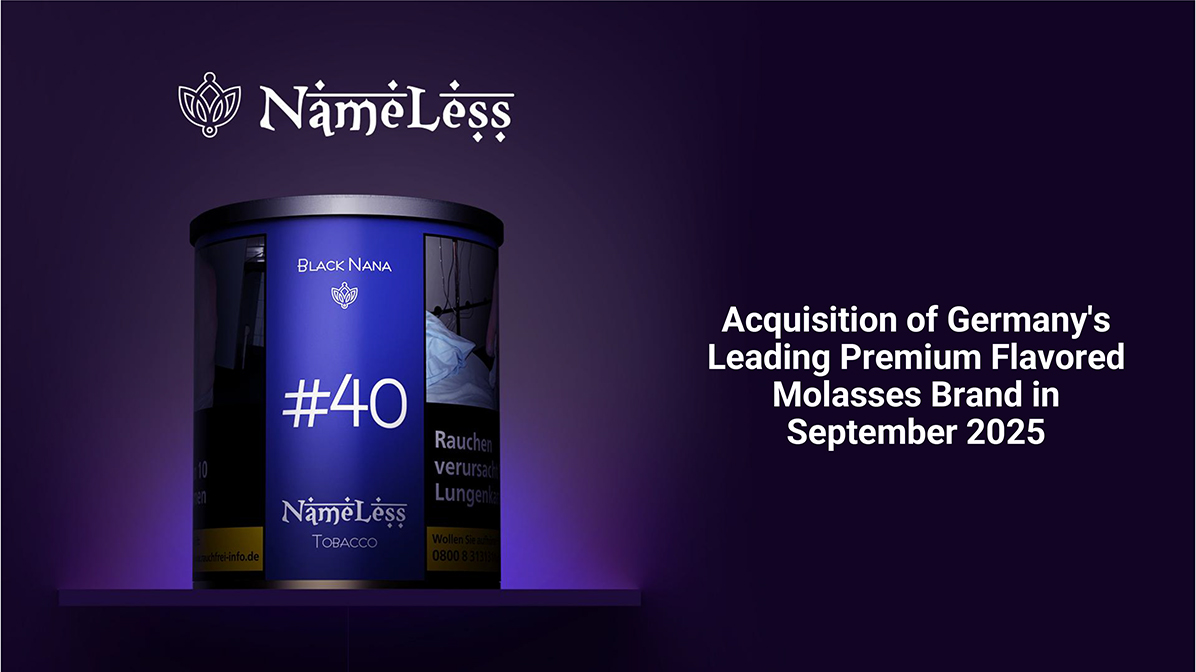
Acquisition of Germany’s Leading Premium Flavored Molasses Brand in September 2025

Headline: Enter your headline here Sub-Header: Enter your optional sub-heading here Enter your text here Line 2 Line 3 Line 4 26 Al Aseel – our first shisha offering for the value-minded consumer in Saudi Arabia(1) Notes: 1. Flavors depicted include Grape, Grape with Berry, Grape with Mint, and Love

Headline: Enter your headline here Sub-Header: Enter your optional sub-heading here Enter your text here Line 2 Line 3 Line 4 Dropped November 2025 in USA and Germany 27

New Growth Categories
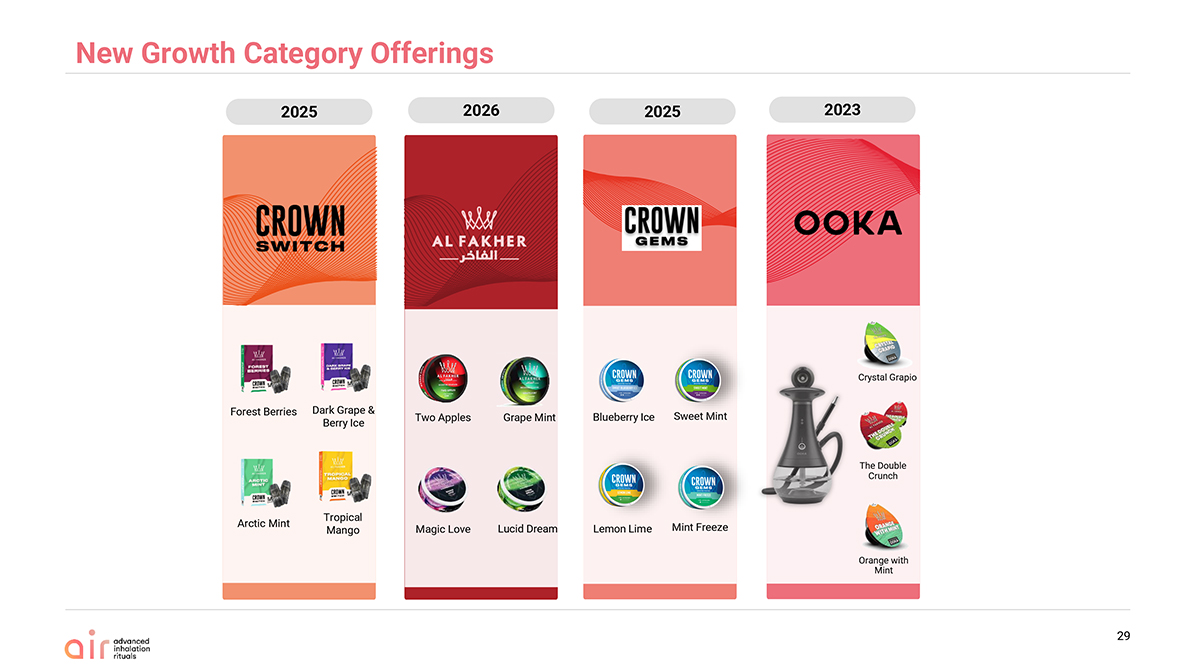
2026 2023 2025 2025 New Growth Category Offerings Two Apples Grape Mint Magic Love Lucid Dream The Double Crunch Crystal Grapio Orange with Mint Forest Berries Arctic Mint Dark Grape & Berry Ice Tropical Mango 29 Blueberry Ice Lemon Lime Sweet Mint Mint Freeze
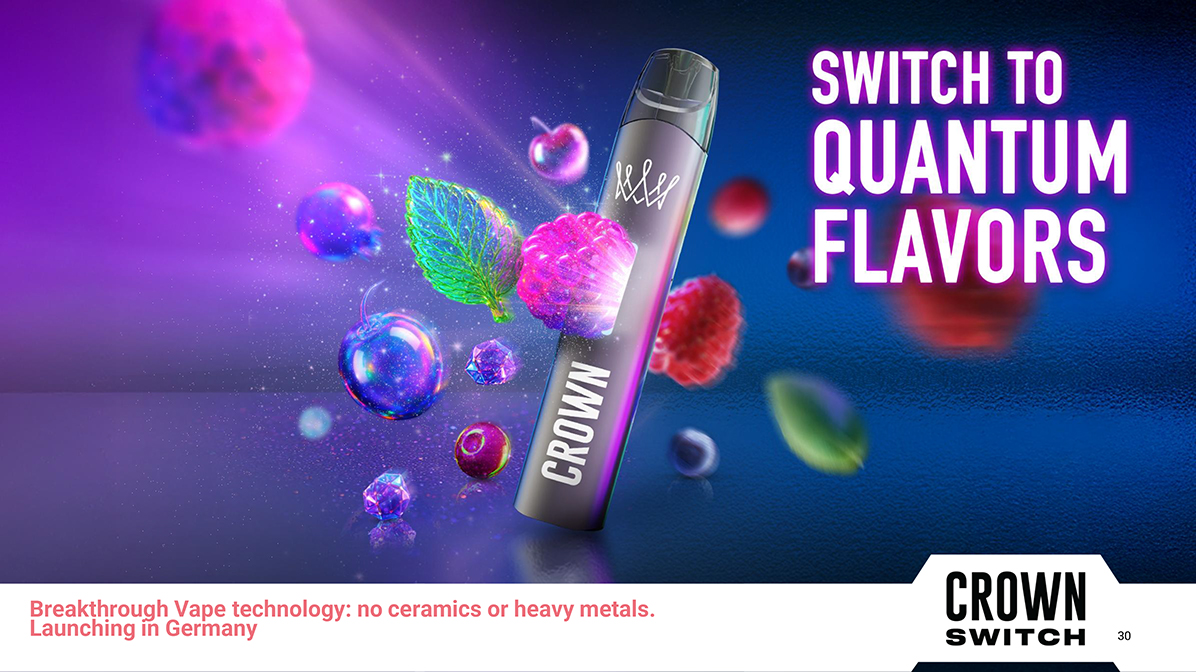
Headline: Enter your headline here Sub-Header: Enter your optional sub-heading here Enter your text here Line 2 Line 3 Line 4 Breakthrough Vape technology: no ceramics or heavy metals.Launching in Germany 30
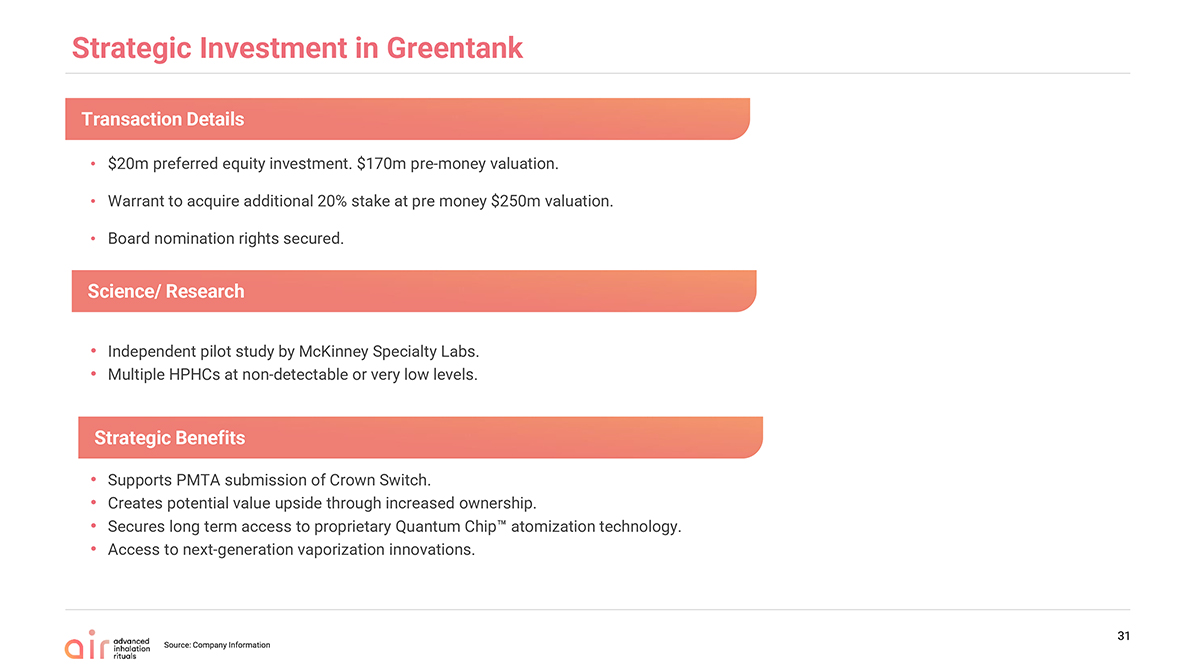
Strategic Investment in Greentank $20m preferred equity investment. $170m pre-money valuation. Warrant to acquire additional 20% stake at pre money $250m valuation. Board nomination rights secured. Source: Company Information 31 Independent pilot study by McKinney Specialty Labs. Multiple HPHCs at non-detectable or very low levels. Supports PMTA submission of Crown Switch. Creates potential value upside through increased ownership. Secures long term access to proprietary Quantum Chip atomization technology. Access to next-generation vaporization innovations. Transaction Details Science/ Research Strategic Benefits
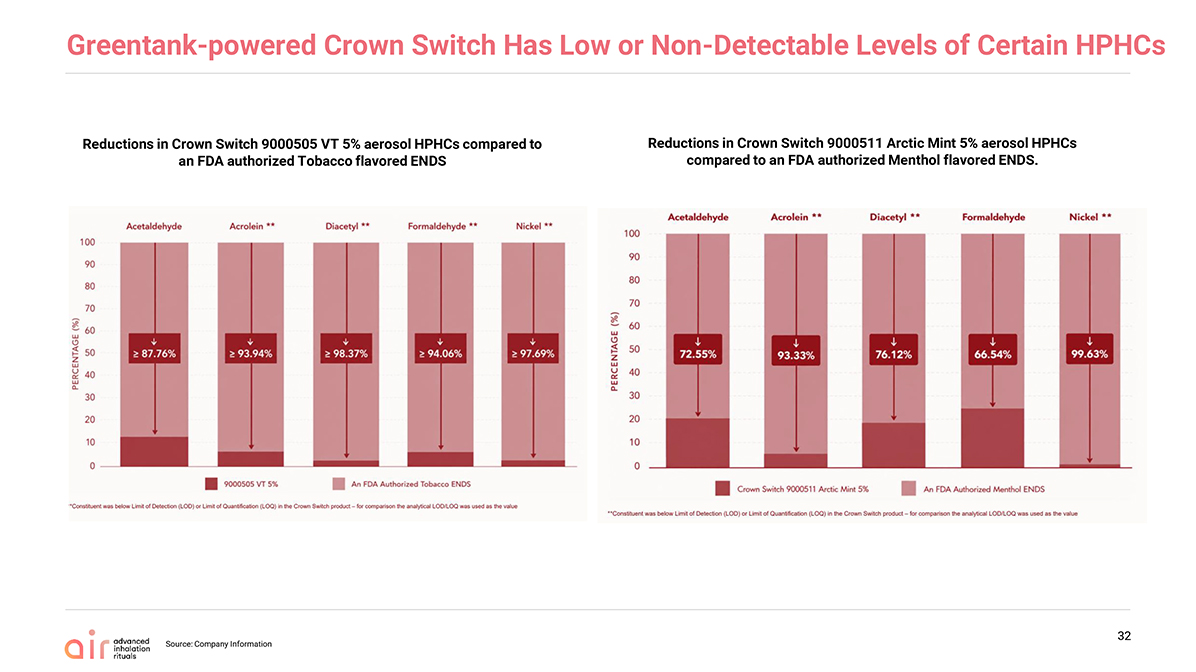
Greentank-powered Crown Switch Has Low or Non-Detectable Levels of Certain HPHCs Source: Company Information 32 Reductions in Crown Switch 9000505 VT 5% aerosol HPHCs compared to an FDA authorized Tobacco flavored ENDS Reductions in Crown Switch 9000511 Arctic Mint 5% aerosol HPHCs compared to an FDA authorized Menthol flavored ENDS.
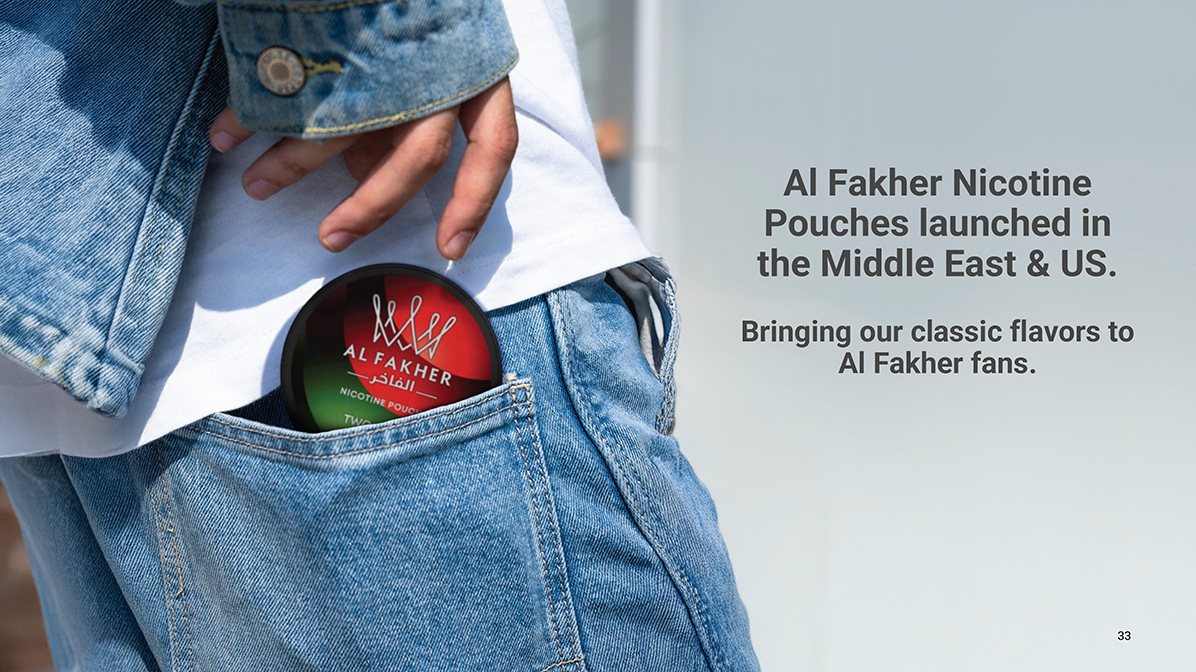
Headline: Enter your headline here Sub-Header: Enter your optional sub-heading here Enter your text here Line 2 Line 3 Line 4 33 Al Fakher Nicotine Pouches launched in the Middle East & US. Bringing our classic flavors to Al Fakher fans.
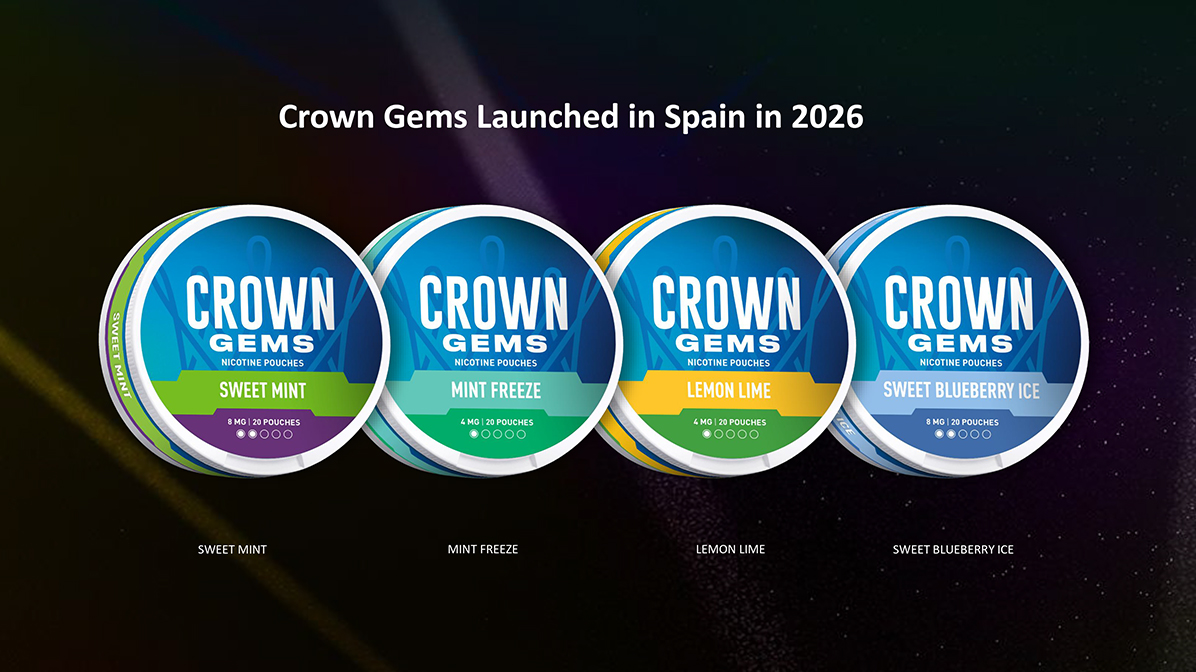
Crown Gems Launched in Spain in 2026 SWEET MINT MINT FREEZE LEMON LIME SWEET BLUEBERRY ICE
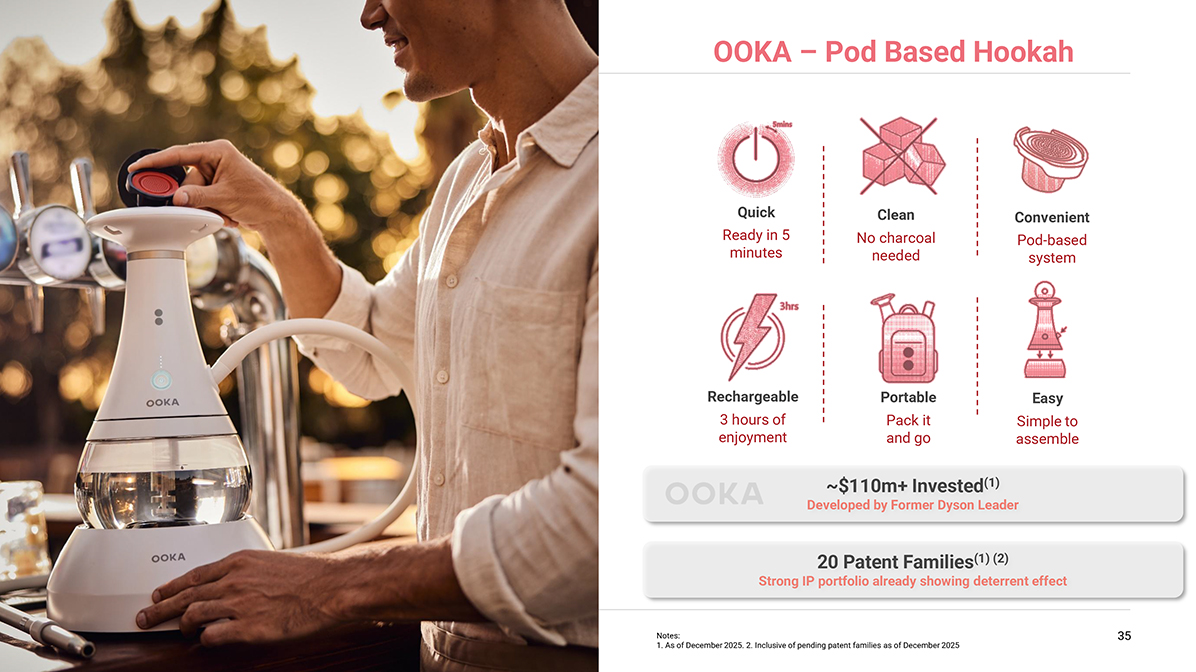
Sub-Header: Enter your optional sub-heading here Enter your text here Line 2 Line 3 Line 4 35 ~$110m+ Invested(1) Developed by Former Dyson Leader 20 Patent Families(1) (2) Strong IP portfolio already showing deterrent effect Quick Ready in 5 minutes Clean No charcoal needed Convenient Pod-based system Rechargeable 3 hours of enjoyment Portable Pack it and go OOKA – Pod Based Hookah Notes: 1. As of December 2025. 2. Inclusive of pending patent families as of December 2025 Easy Simple to assemble
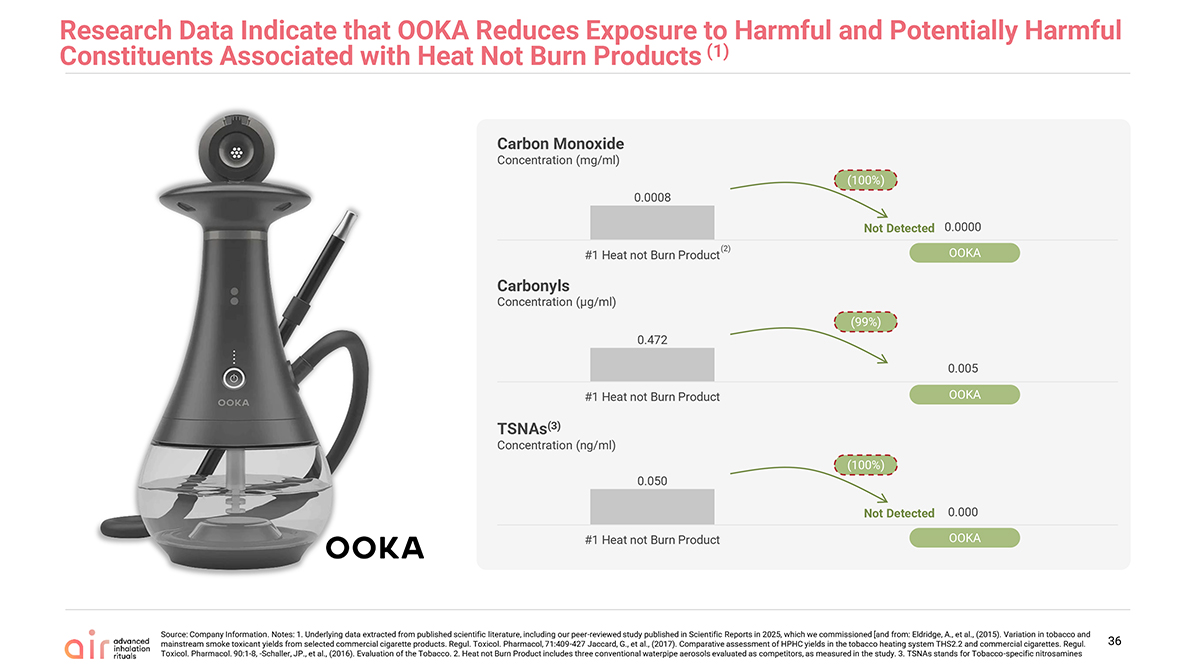
Source: Company Information. Notes: 1. Underlying data extracted from published scientific literature, including our peer-reviewed study published in Scientific Reports in 2025, which we commissioned [and from: Eldridge, A., et al., (2015). Variation in tobacco and mainstream smoke toxicant yields from selected commercial cigarette products. Regul. Toxicol. Pharmacol, 71:409-427 Jaccard, G., et al., (2017). Comparative assessment of HPHC yields in the tobacco heating system THS2.2 and commercial cigarettes. Regul. Toxicol. Pharmacol. 90:1-8, -Schaller, JP., et al., (2016). Evaluation of the Tobacco. 2. Heat not Burn Product includes three conventional waterpipe aerosols evaluated as competitors, as measured in the study. 3. TSNAs stands for Tobacco-specific nitrosamines Carbon Monoxide Concentration (mg/ml) OOKA Not Detected (100%) Carbonyls Concentration (µg/ml) OOKA (99%) TSNAs(3) Concentration (ng/ml) OOKA Not Detected (100%) (2) 36 Research Data Indicate that OOKA Reduces Exposure to Harmful and Potentially Harmful Constituents Associated with Heat Not Burn Products (1)0.0008 0.0000 #1 Heat not Burn Product OOKA0.472 0.005 #1 Heat not Burn Product OOKA0.050 0.000 #1 Heat not Burn Product OOKA
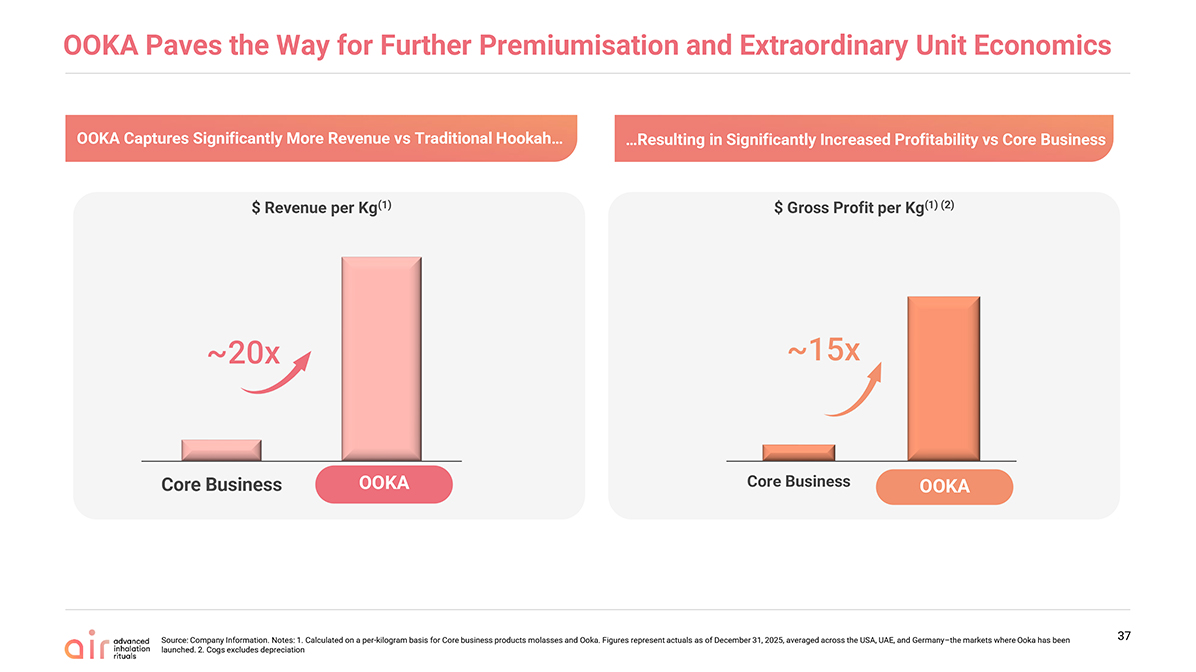
OOKA Paves the Way for Further Premiumisation and Extraordinary Unit Economics Source: Company Information. Notes: 1. Calculated on a per-kilogram basis for Core business products molasses and Ooka. Figures represent actuals as of December 31, 2025, averaged across the USA, UAE, and Germany–the markets where Ooka has been launched. 2. Cogs excludes depreciation 37 $ Gross Profit per Kg(1) (2) ~15x OOKA OOKA Captures Significantly More Revenue vs Traditional Hookah… $ Revenue per Kg(1) ~20x OOKA …Resulting in Significantly Increased Profitability vs Core BusinessCore Business OOKA Core Business

Historical Financial Information
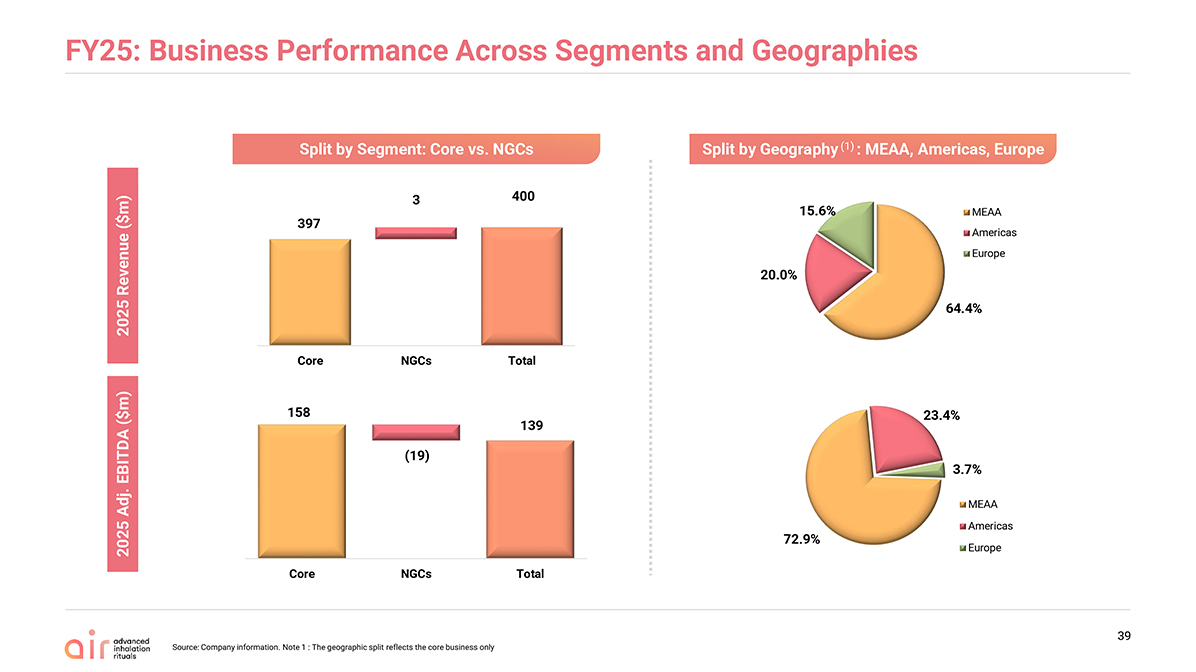
FY25: Business Performance Across Segments and Geographies Split by Segment: Core vs. NGCs Split by Geography (1) : MEAA, Americas, Europe Source: Company information. Note 1 : The geographic split reflects the core business only 39 2025 Revenue (%) 2025 Adj. EBITDA (%) 2025 Revenue ($m) 2025 Adj. EBITDA ($m) 397 3 400 158 (19) 13964.4% 20.0%15.6% MEAA Americas Europe 72.9% 23.4%3.7% MEAA Americas Europe Core NGCs Total Core NGCs Total
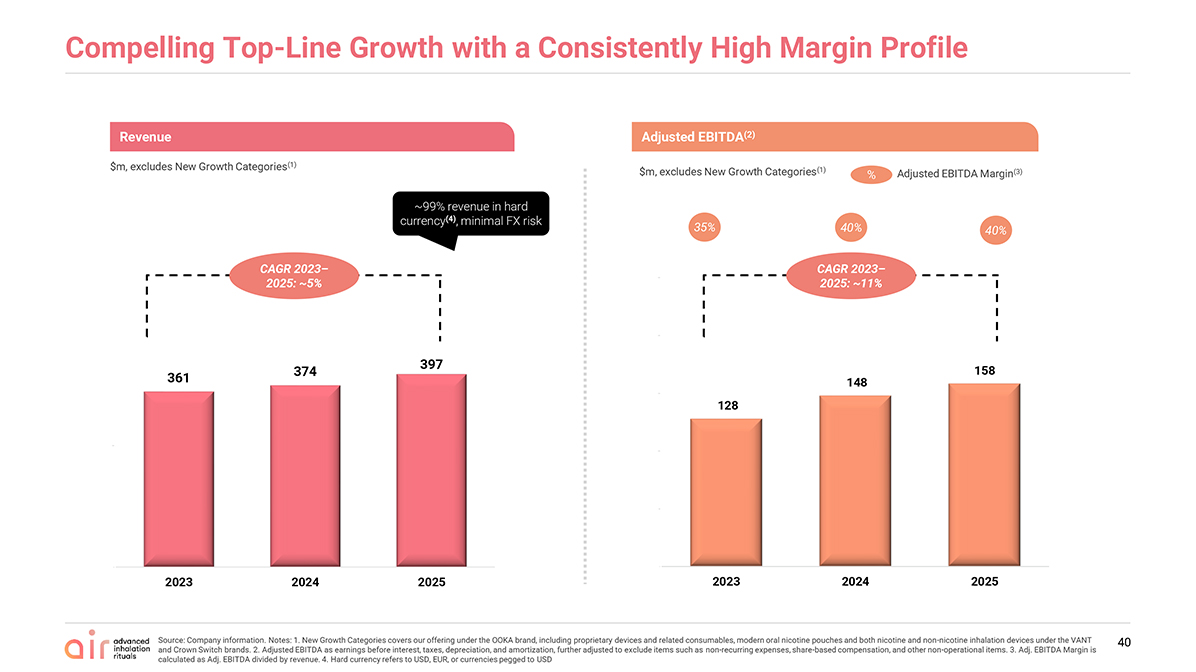
Compelling Top-Line Growth with a Consistently High Margin Profile 40 Revenue $m, excludes New Growth Categories(1) ~99% revenue in hard currency(4), minimal FX risk CAGR 2023–2025: ~5% Adjusted EBITDA(2) $m, excludes New Growth Categories(1) % Adjusted EBITDA Margin(3) 35% 40% 40% CAGR 2023–2025: ~11% Source: Company information. Notes: 1. New Growth Categories covers our offering under the OOKA brand, including proprietary devices and related consumables, modern oral nicotine pouches and both nicotine and non-nicotine inhalation devices under the VANT and Crown Switch brands. 2. Adjusted EBITDA as earnings before interest, taxes, depreciation, and amortization, further adjusted to exclude items such as non-recurring expenses, share-based compensation, and other non-operational items. 3. Adj. EBITDA Margin is calculated as Adj. EBITDA divided by revenue. 4. Hard currency refers to USD, EUR, or currencies pegged to USD361 374 397 0 250 2023 2024 2025 128 148 158 0 50 100 150 200 250 2023 2024 2025
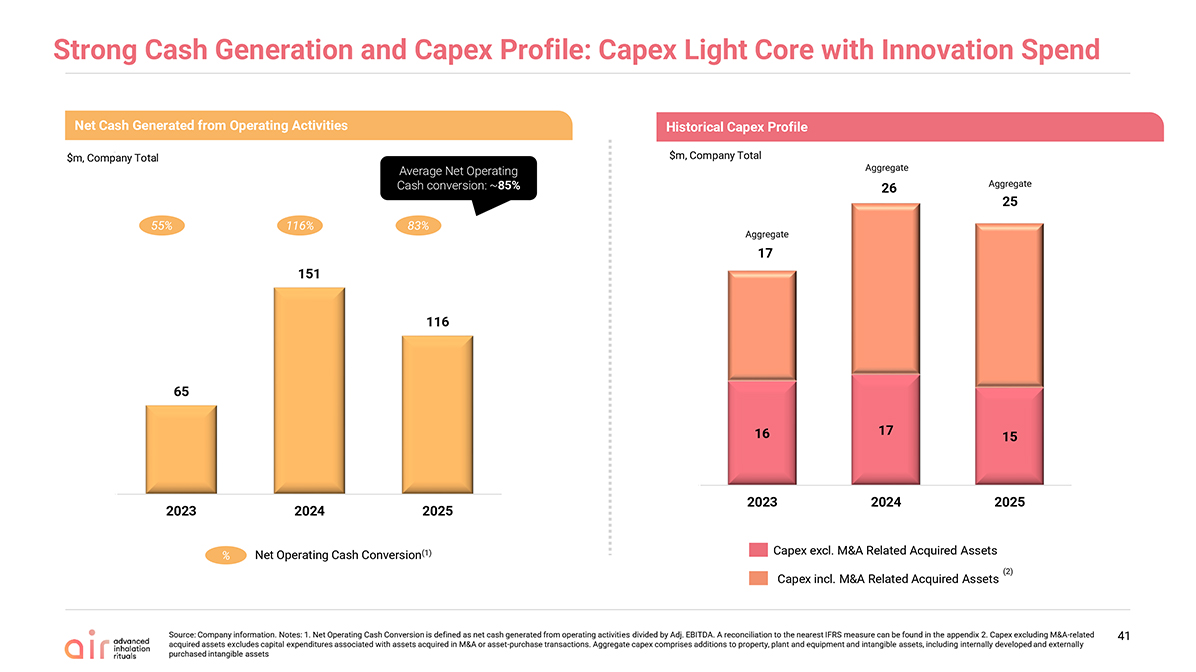
Strong Cash Generation and Capex Profile: Capex Light Core with Innovation Spend Net Cash Generated from Operating Activities $m, Company Total 55% 116% % Net Operating Cash Conversion(1) Average Net Operating Cash conversion: ~85% 83% 41 Source: Company information. Notes: 1. Net Operating Cash Conversion is defined as net cash generated from operating activities divided by Adj. EBITDA. A reconciliation to the nearest IFRS measure can be found in the appendix 2. Capex excluding M&A-related acquired assets excludes capital expenditures associated with assets acquired in M&A or asset-purchase transactions. Aggregate capex comprises additions to property, plant and equipment and intangible assets, including internally developed and externally purchased intangible assets Aggregate Historical Capex Profile $m, Company Total Capex excl. M&A Related Acquired Assets Capex incl. M&A Related Acquired Assets Aggregate Aggregate (2)65 151 116 0 250 2023 2024 2025 16 17 15 17 26 25 0 2023 2024 2025
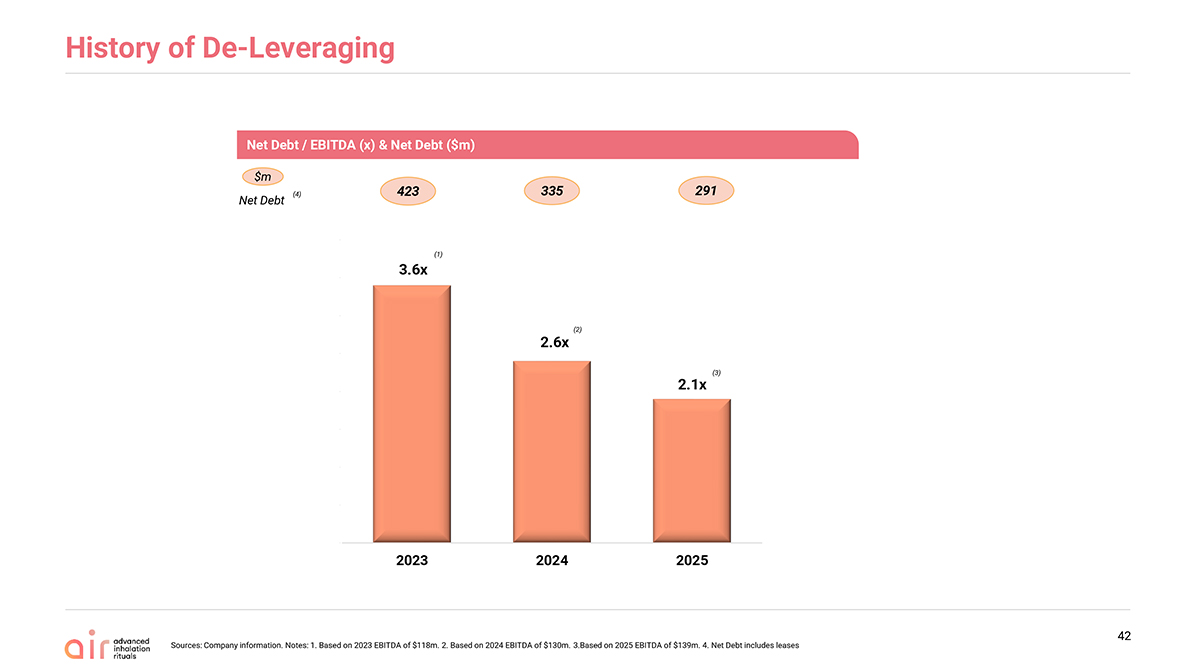
Net Debt / EBITDA (x) & Net Debt ($m) 423 $m Net Debt 291 (1) History of De-Leveraging Sources: Company information. Notes: 1. Based on 2023 EBITDA of $118m. 2. Based on 2024 EBITDA of $130m. 3.Based on 2025 EBITDA of $139m. 4. Net Debt includes leases 335 (2) (3) 42 (4)3.6x 2.6x 2.1x 011223344 2023 2024 2025

Latest Results: H1’26
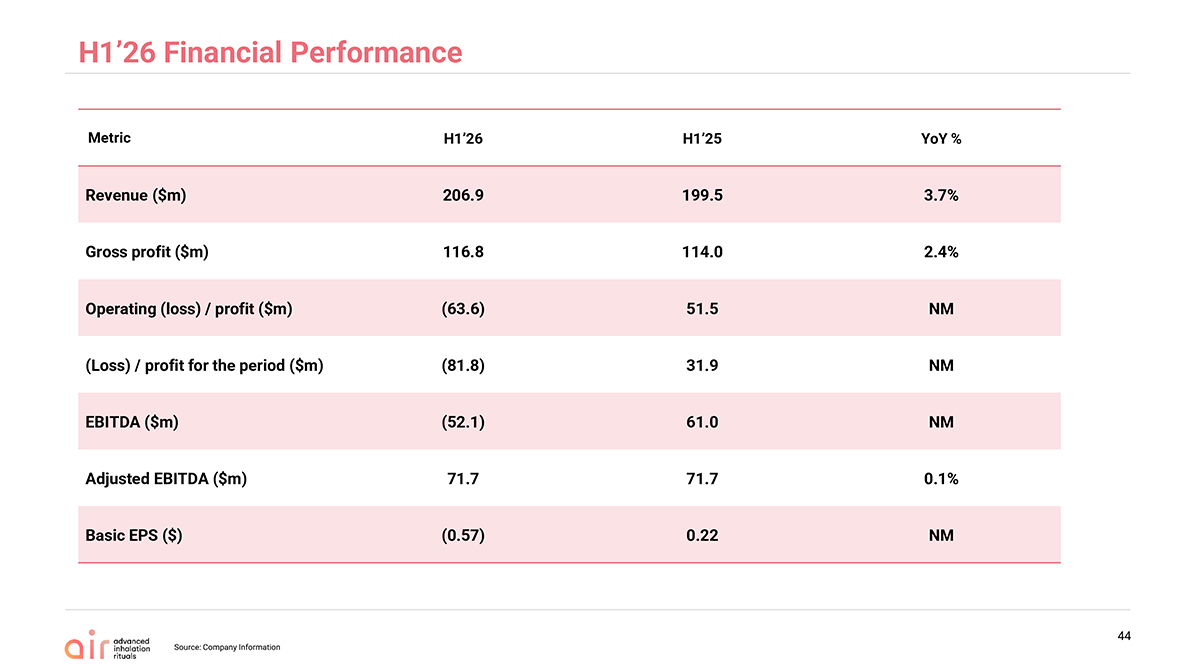
H1’26 Financial Performance Source: Company Information 44Metric H1’26 H1’25YoY % Revenue ($m)206.9199.53.7% Gross profit ($m)116.8114.02.4% Operating (loss) / profit ($m)(63.6)51.5NM (Loss) / profit for the period ($m)(81.8)31.9NM EBITDA ($m)(52.1)61.0NM Adjusted EBITDA ($m)71.771.70.1% Basic EPS ($)(0.57)0.22NM
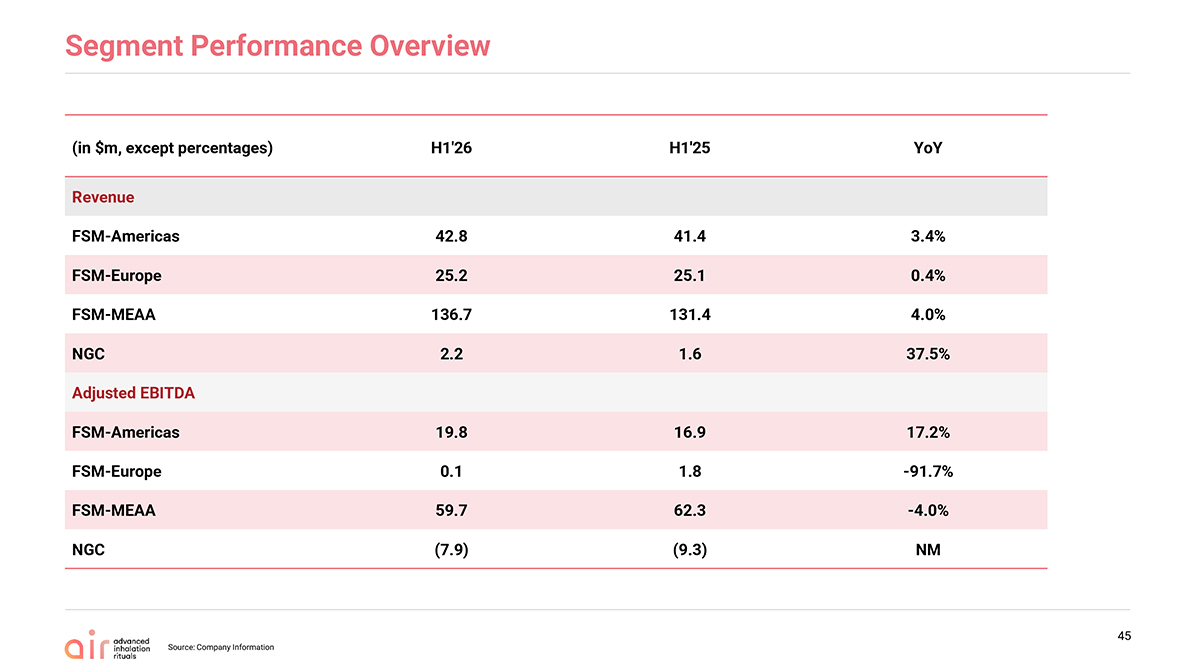
Segment Performance Overview 45(in $m, except percentages) H1’26 H1’25YoY Revenue FSM-Americas42.8 41.4 3.4% FSM-Europe25.2 25.1 0.4% FSM-MEAA136.7 131.4 4.0% NGC2.2 1.6 37.5% Adjusted EBITDA FSM-Americas19.8 16.9 17.2% FSM-Europe0.1 1.8 -91.7% FSM-MEAA59.7 62.3 -4.0% NGC(7.9)(9.3) NM
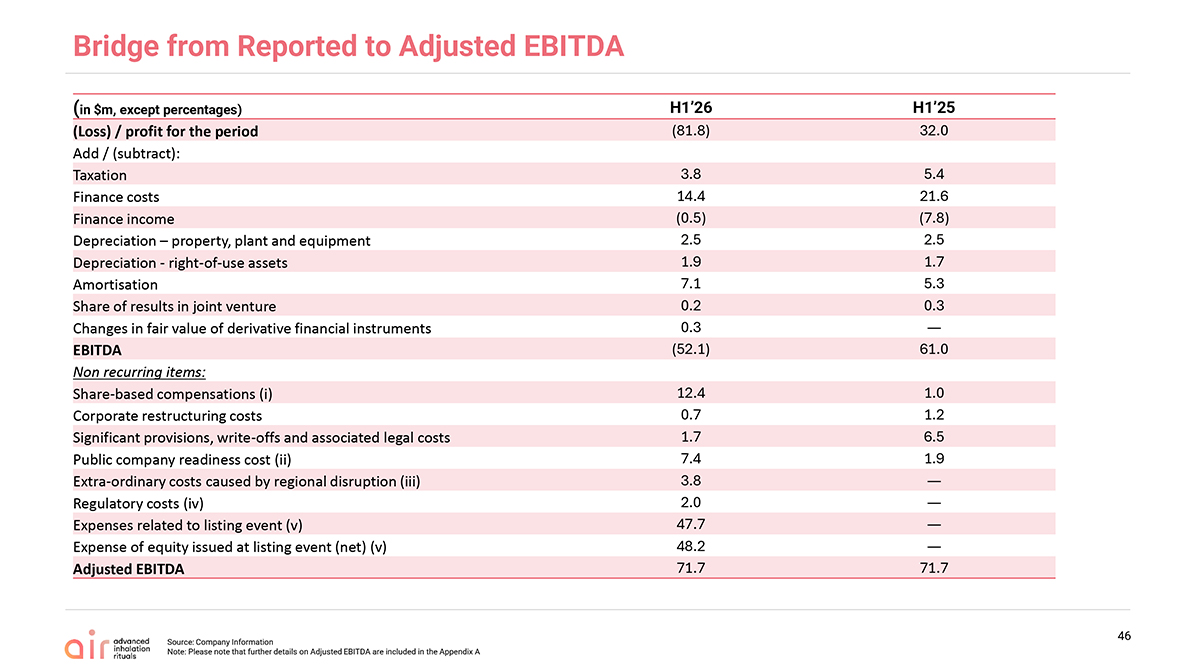
Bridge from Reported to Adjusted EBITDA 46(in $m, except percentages) H1’26 H1’25 (Loss) / profit for the period(81.8)32.0 Add / (subtract): Taxation3.85.4 Finance costs14.421.6 Finance income(0.5)(7.8) Depreciation – property, plant and equipment2.52.5 Depreciation—right-of-use assets1.91.7 Amortisation7.15.3 Share of results in joint venture0.20.3 Changes in fair value of derivative financial instruments0.3— EBITDA(52.1)61.0 Non recurring items: Share-based compensations (i)12.41.0 Corporate restructuring costs0.71.2 Significant provisions, write-offs and associated legal costs1.76.5 Public company readiness cost (ii)7.41.9 Extra-ordinary costs caused by regional disruption (iii)3.8— Regulatory costs (iv)2.0— Expenses related to listing event (v)47.7— Expense of equity issued at listing event (net) (v)48.2— Adjusted EBITDA71.771.7
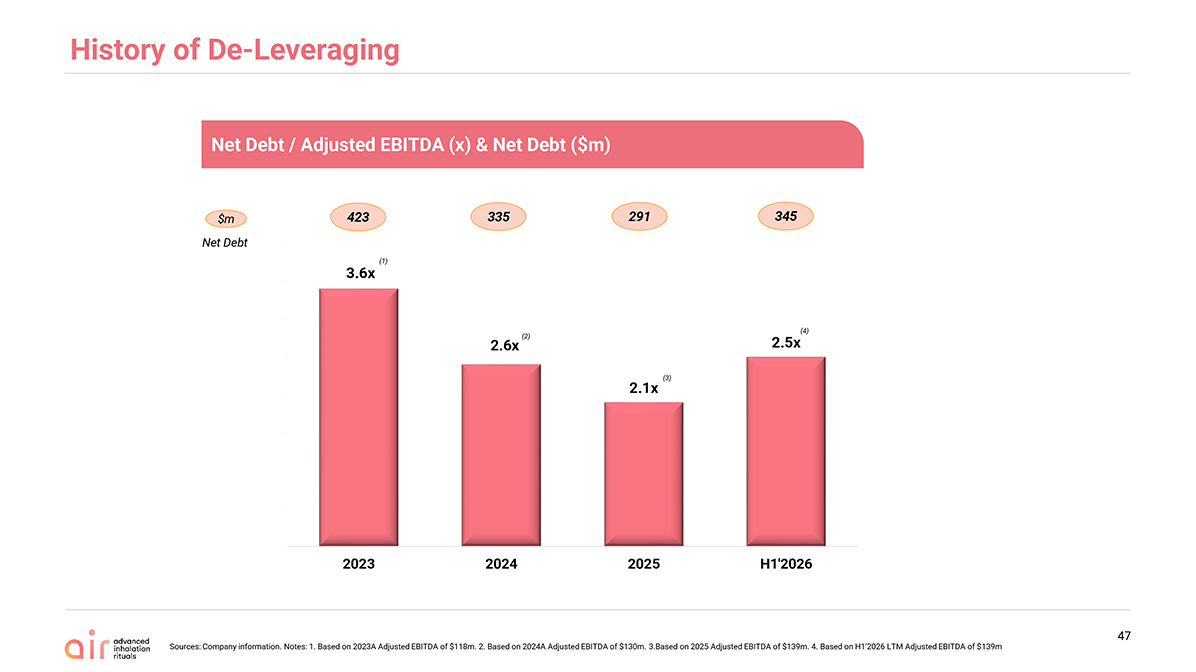
History of De-Leveraging 47 Net Debt / Adjusted EBITDA (x) & Net Debt ($m) 423 $m Net Debt 291 (1) 335 (2) (3) 345 Sources: Company information. Notes: 1. Based on 2023A Adjusted EBITDA of $118m. 2. Based on 2024A Adjusted EBITDA of $130m. 3.Based on 2025 Adjusted EBITDA of $139m. 4. Based on H1’2026 LTM Adjusted EBITDA of $139m (4)3.6x 2.6x 2.1x 2.5x 011223344 2023 2024 2025 H1’2026

Summary
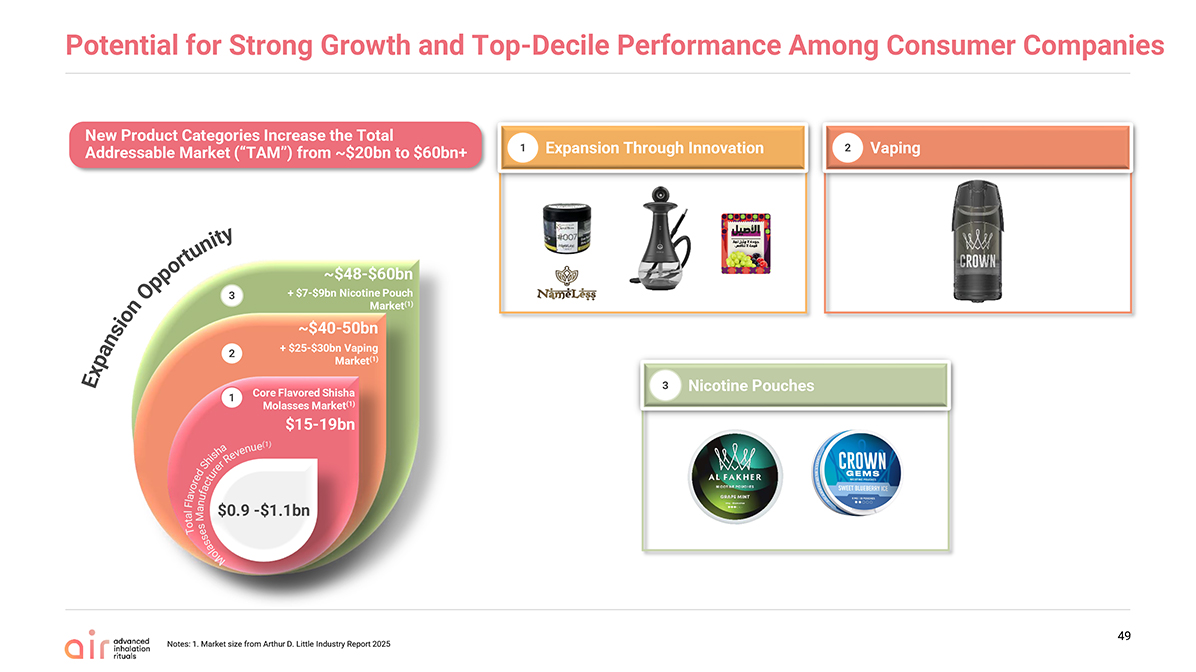
Potential for Strong Growth and Top-Decile Performance Among Consumer Companies Notes: 1. Market size from Arthur D. Little Industry Report 2025 49 Nicotine Pouches 3 Expansion Through Innovation Vaping 1 2 New Product Categories Increase the Total Addressable Market (“TAM”) from ~$20bn to $60bn+ ExpansionOpportunity $0.9 -$1.1bn $15-19bn Core Flavored Shisha Molasses Market(1) + $25-$30bn Vaping Market(1) ~$40-50bn + $7-$9bn Nicotine Pouch Market(1) ~$48-$60bn 2 3 1 TotalFlavoredShishaMolassesManufacturerRevenue(1)

Glossary & Appendix
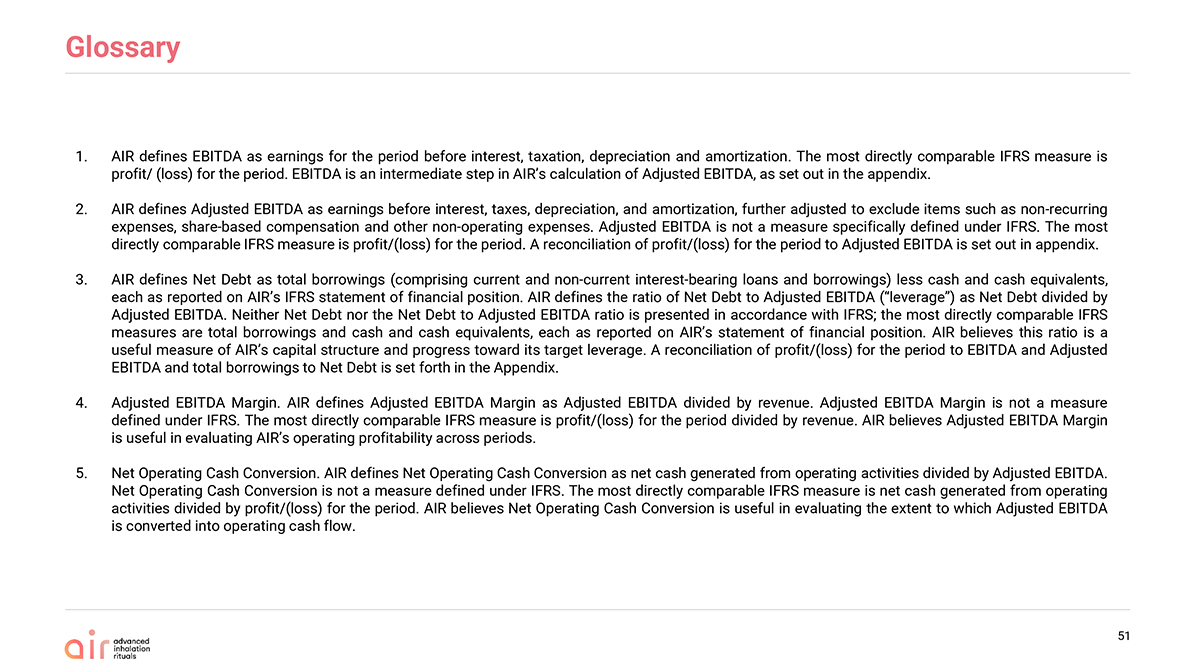
Glossary 51 AIR defines EBITDA as earnings for the period before interest, taxation, depreciation and amortization. The most directly comparable IFRS measure is profit/ (loss) for the period. EBITDA is an intermediate step in AIR’s calculation of Adjusted EBITDA, as set out in the appendix. AIR defines Adjusted EBITDA as earnings before interest, taxes, depreciation, and amortization, further adjusted to exclude items such as non-recurring expenses, share-based compensation and other non-operating expenses. Adjusted EBITDA is not a measure specifically defined under IFRS. The most directly comparable IFRS measure is profit/(loss) for the period. A reconciliation of profit/(loss) for the period to Adjusted EBITDA is set out in appendix. AIR defines Net Debt as total borrowings (comprising current and non-current interest-bearing loans and borrowings) less cash and cash equivalents, each as reported on AIR’s IFRS statement of financial position. AIR defines the ratio of Net Debt to Adjusted EBITDA (“leverage”) as Net Debt divided by Adjusted EBITDA. Neither Net Debt nor the Net Debt to Adjusted EBITDA ratio is presented in accordance with IFRS; the most directly comparable IFRS measures are total borrowings and cash and cash equivalents, each as reported on AIR’s statement of financial position. AIR believes this ratio is a useful measure of AIR’s capital structure and progress toward its target leverage. A reconciliation of profit/(loss) for the period to EBITDA and Adjusted EBITDA and total borrowings to Net Debt is set forth in the Appendix. Adjusted EBITDA Margin. AIR defines Adjusted EBITDA Margin as Adjusted EBITDA divided by revenue. Adjusted EBITDA Margin is not a measure defined under IFRS. The most directly comparable IFRS measure is profit/(loss) for the period divided by revenue. AIR believes Adjusted EBITDA Margin is useful in evaluating AIR’s operating profitability across periods. Net Operating Cash Conversion. AIR defines Net Operating Cash Conversion as net cash generated from operating activities divided by Adjusted EBITDA. Net Operating Cash Conversion is not a measure defined under IFRS. The most directly comparable IFRS measure is net cash generated from operating activities divided by profit/(loss) for the period. AIR believes Net Operating Cash Conversion is useful in evaluating the extent to which Adjusted EBITDA is converted into operating cash flow.
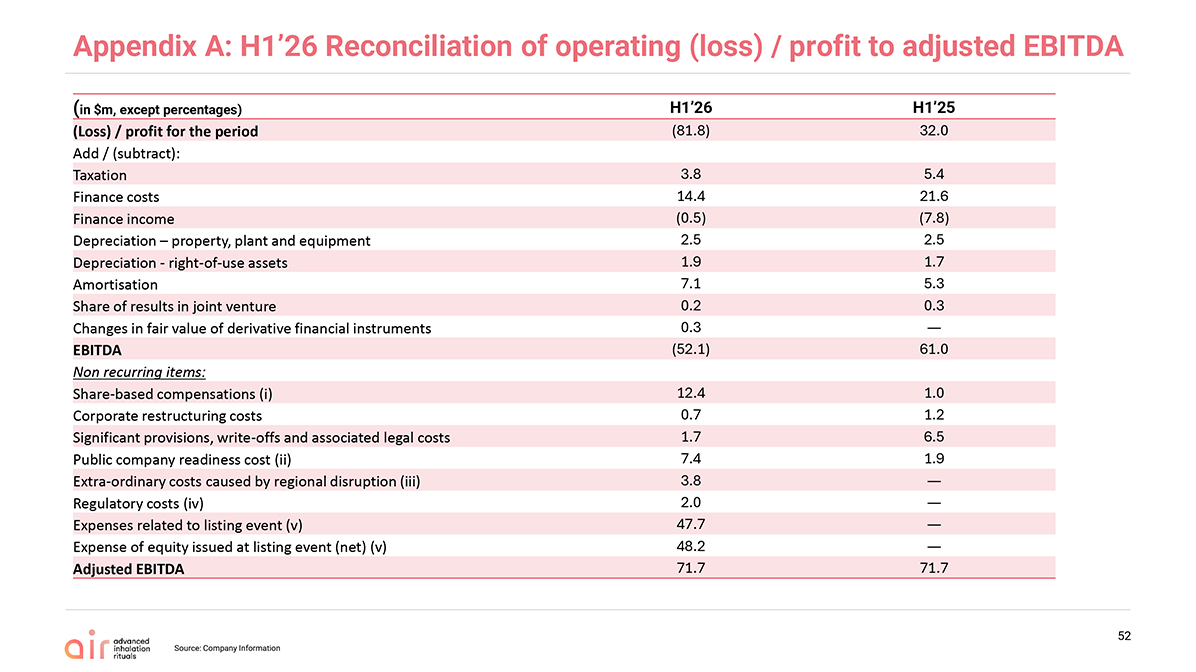
Appendix A: H1’26 Reconciliation of operating (loss) / profit to adjusted EBITDA 52(in $m, except percentages) H1’26 H1’25 (Loss) / profit for the period(81.8)32.0 Add / (subtract): Taxation3.85.4 Finance costs14.421.6 Finance income(0.5)(7.8) Depreciation – property, plant and equipment2.52.5 Depreciation—right-of-use assets1.91.7 Amortisation7.15.3 Share of results in joint venture0.20.3 Changes in fair value of derivative financial instruments0.3— EBITDA(52.1)61.0 Non recurring items: Share-based compensations (i)12.41.0 Corporate restructuring costs0.71.2 Significant provisions, write-offs and associated legal costs1.76.5 Public company readiness cost (ii)7.41.9 Extra-ordinary costs caused by regional disruption (iii)3.8— Regulatory costs (iv)2.0— Expenses related to listing event (v)47.7— Expense of equity issued at listing event (net) (v)48.2— Adjusted EBITDA71.771.7
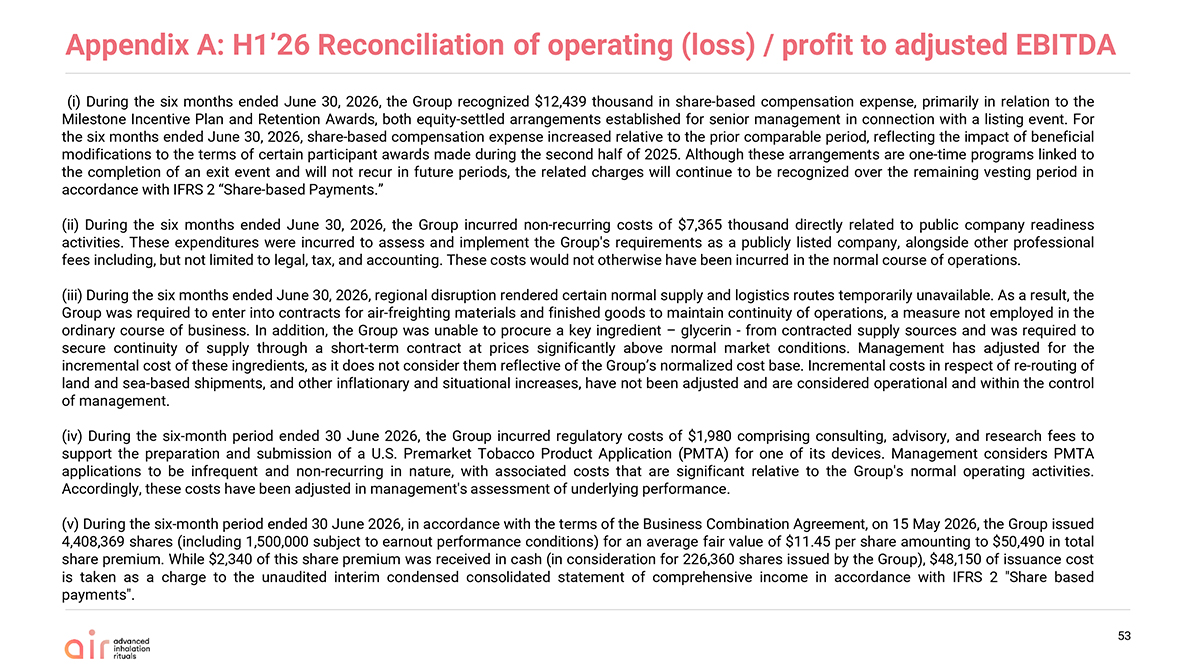
Appendix A: H1’26 Reconciliation of operating (loss) / profit to adjusted EBITDA 53 (i) During the six months ended June 30, 2026, the Group recognized $12,439 thousand in share-based compensation expense, primarily in relation to the Milestone Incentive Plan and Retention Awards, both equity-settled arrangements established for senior management in connection with a listing event. For the six months ended June 30, 2026, share-based compensation expense increased relative to the prior comparable period, reflecting the impact of beneficial modifications to the terms of certain participant awards made during the second half of 2025. Although these arrangements are one-time programs linked to the completion of an exit event and will not recur in future periods, the related charges will continue to be recognized over the remaining vesting period in accordance with IFRS 2 “Share-based Payments.” (ii) During the six months ended June 30, 2026, the Group incurred non-recurring costs of $7,365 thousand directly related to public company readiness activities. These expenditures were incurred to assess and implement the Group’s requirements as a publicly listed company, alongside other professional fees including, but not limited to legal, tax, and accounting. These costs would not otherwise have been incurred in the normal course of operations. (iii) During the six months ended June 30, 2026, regional disruption rendered certain normal supply and logistics routes temporarily unavailable. As a result, the Group was required to enter into contracts for air-freighting materials and finished goods to maintain continuity of operations, a measure not employed in the ordinary course of business. In addition, the Group was unable to procure a key ingredient – glycerin—from contracted supply sources and was required to secure continuity of supply through a short-term contract at prices significantly above normal market conditions. Management has adjusted for the incremental cost of these ingredients, as it does not consider them reflective of the Group’s normalized cost base. Incremental costs in respect of re-routing of land and sea-based shipments, and other inflationary and situational increases, have not been adjusted and are considered operational and within the control of management. (iv) During the six-month period ended 30 June 2026, the Group incurred regulatory costs of $1,980 comprising consulting, advisory, and research fees to support the preparation and submission of a U.S. Premarket Tobacco Product Application (PMTA) for one of its devices. Management considers PMTA applications to be infrequent and non-recurring in nature, with associated costs that are significant relative to the Group’s normal operating activities. Accordingly, these costs have been adjusted in management’s assessment of underlying performance. (v) During the six-month period ended 30 June 2026, in accordance with the terms of the Business Combination Agreement, on 15 May 2026, the Group issued 4,408,369 shares (including 1,500,000 subject to earnout performance conditions) for an average fair value of $11.45 per share amounting to $50,490 in total share premium. While $2,340 of this share premium was received in cash (in consideration for 226,360 shares issued by the Group), $48,150 of issuance cost is taken as a charge to the unaudited interim condensed consolidated statement of comprehensive income in accordance with IFRS 2 “Share based payments”.
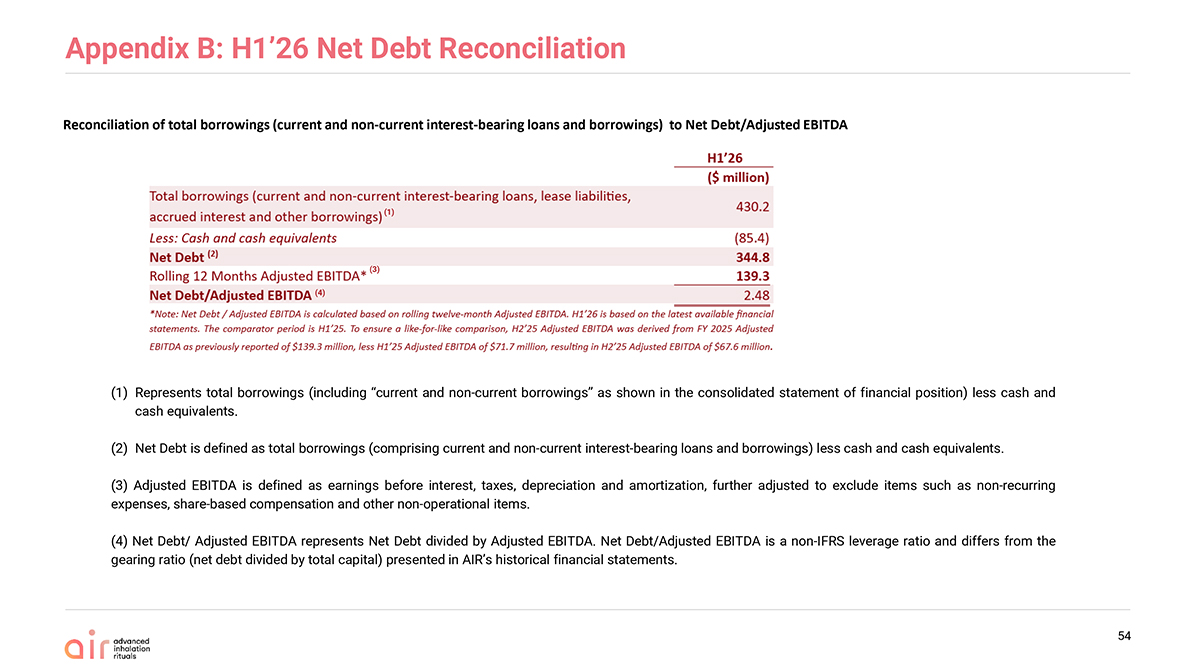
Appendix B: H1’26 Net Debt Reconciliation 54 Reconciliation of total borrowings (current and non-current interest-bearing loans and borrowings) to Net Debt/Adjusted EBITDA (1)Represents total borrowings (including “current and non-current borrowings” as shown in the consolidated statement of financial position) less cash and cash equivalents. (2)Net Debt is defined as total borrowings (comprising current and non-current interest-bearing loans and borrowings) less cash and cash equivalents. (3) Adjusted EBITDA is defined as earnings before interest, taxes, depreciation and amortization, further adjusted to exclude items such as non-recurring expenses, share-based compensation and other non-operational items. (4) Net Debt/ Adjusted EBITDA represents Net Debt divided by Adjusted EBITDA. Net Debt/Adjusted EBITDA is a non-IFRS leverage ratio and differs from the gearing ratio (net debt divided by total capital) presented in AIR’s historical financial statements. (1) (3) (4)
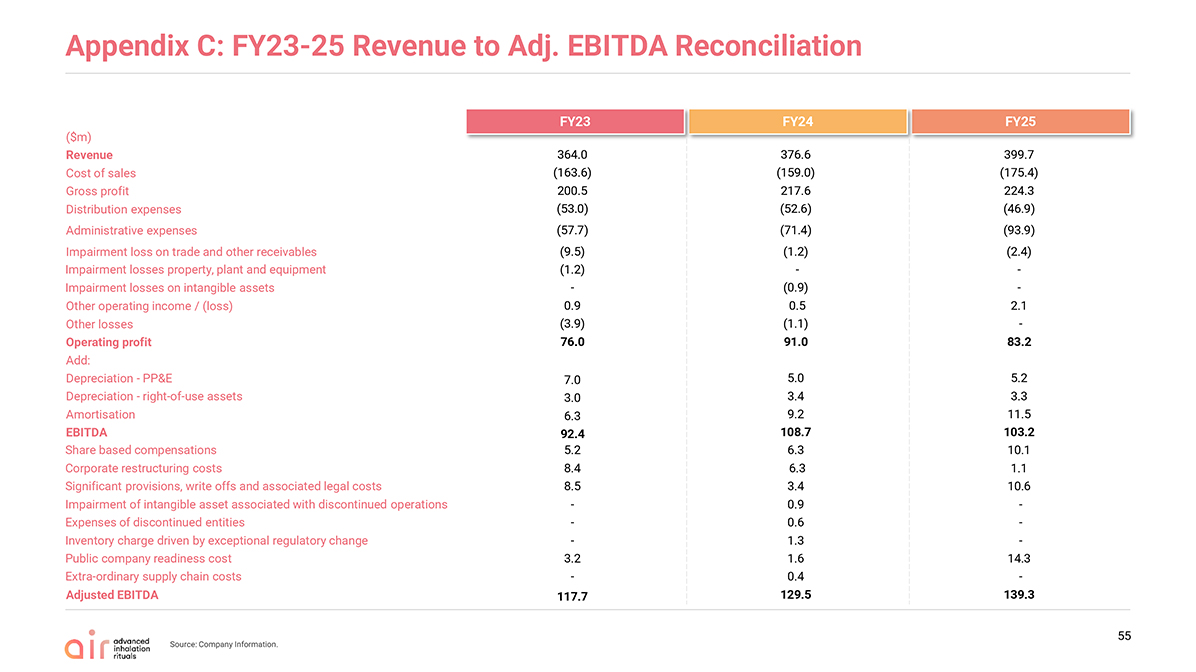
($m) Revenue 364.0 376.6 399.7 Cost of sales(163.6)(159.0)(175.4) Gross profit200.5217.6 224.3 Distribution expenses(53.0)(52.6)(46.9) Administrative expenses(57.7)(71.4)(93.9) Impairment loss on trade and other receivables(9.5)(1.2)(2.4) Impairment losses property, plant and equipment(1.2)- - Impairment losses on intangible assets-(0.9)- Other operating income / (loss)0.90.5 2.1 Other losses(3.9)(1.1)- Operating profit76.091.0 83.2 Add: Depreciation—PP&E7.05.0 5.2 Depreciation—right-of-use assets3.03.4 3.3 Amortisation6.39.2 11.5 EBITDA92.4108.7 103.2 Share based compensations5.26.3 10.1 Corporate restructuring costs 8.46.3 1.1 Significant provisions, write offs and associated legal costs8.53.4 10.6 Impairment of intangible asset associated with discontinued operations-0.9 - Expenses of discontinued entities-0.6 - Inventory charge driven by exceptional regulatory change -1.3 - Public company readiness cost 3.21.6 14.3 Extra-ordinary supply chain costs-0.4 - Adjusted EBITDA117.7129.5 139.3
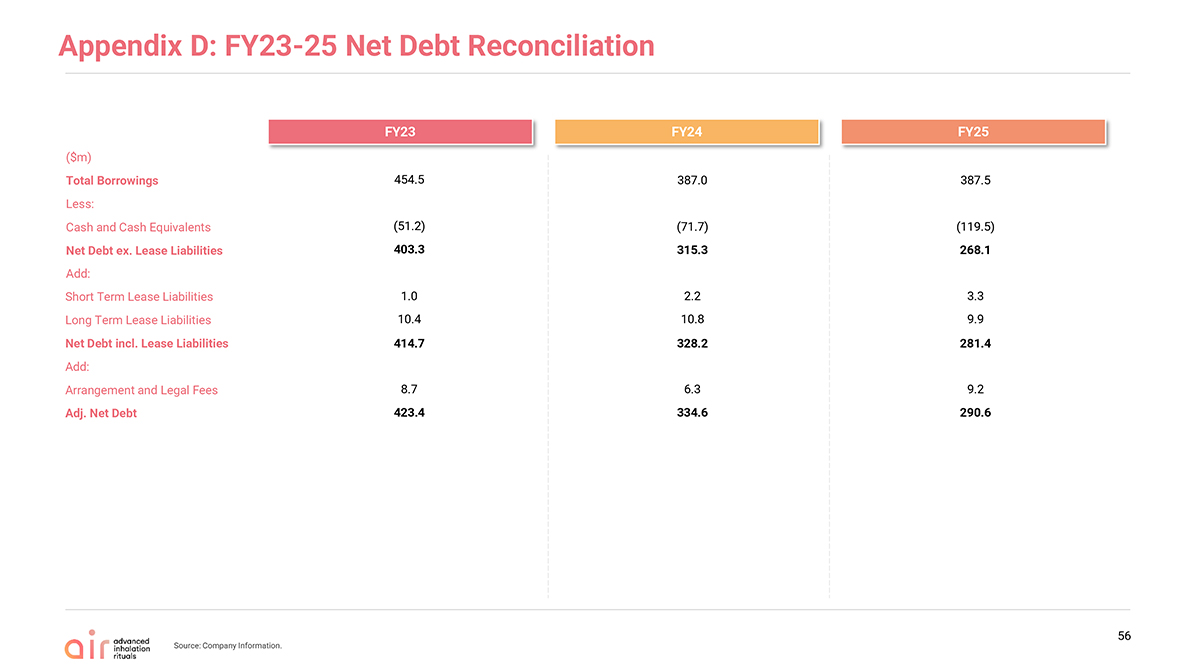
Appendix D: FY23-25 Net Debt Reconciliation 56($m) Total Borrowings 454.5 387.0 387.5 Less: Cash and Cash Equivalents(51.2)(71.7)(119.5) Net Debt ex. Lease Liabilities 403.3315.3268.1 Add: Short Term Lease Liabilities1.02.2 3.3 Long Term Lease Liabilities10.410.8 9.9 Net Debt incl. Lease Liabilities414.7328.2281.4 Add: Arrangement and Legal Fees8.76.3 9.2 Adj. Net Debt423.4334.6290.6